Gather and classify
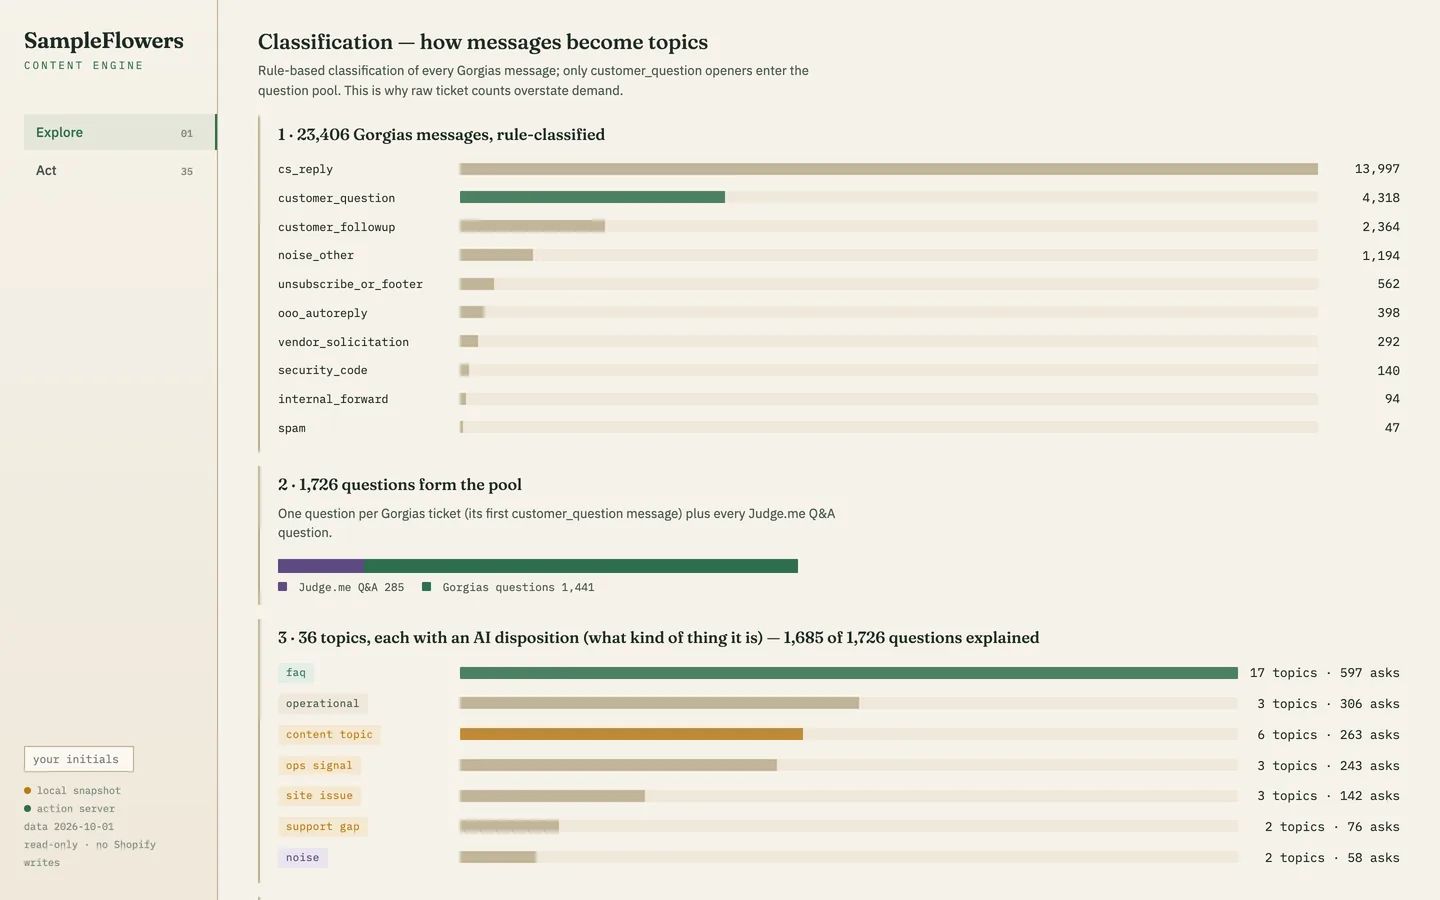
Support conversations, product-page questions, reviews and every existing answer go into one analysis database. Rules sort each support message, so only real customer questions enter the pool.
FiftyFlowers · Content from customer questions

Six months of support conversations, product-page questions and reviews, grouped into topics and checked against what the website already answers, with a review queue of the answers and articles that are missing.
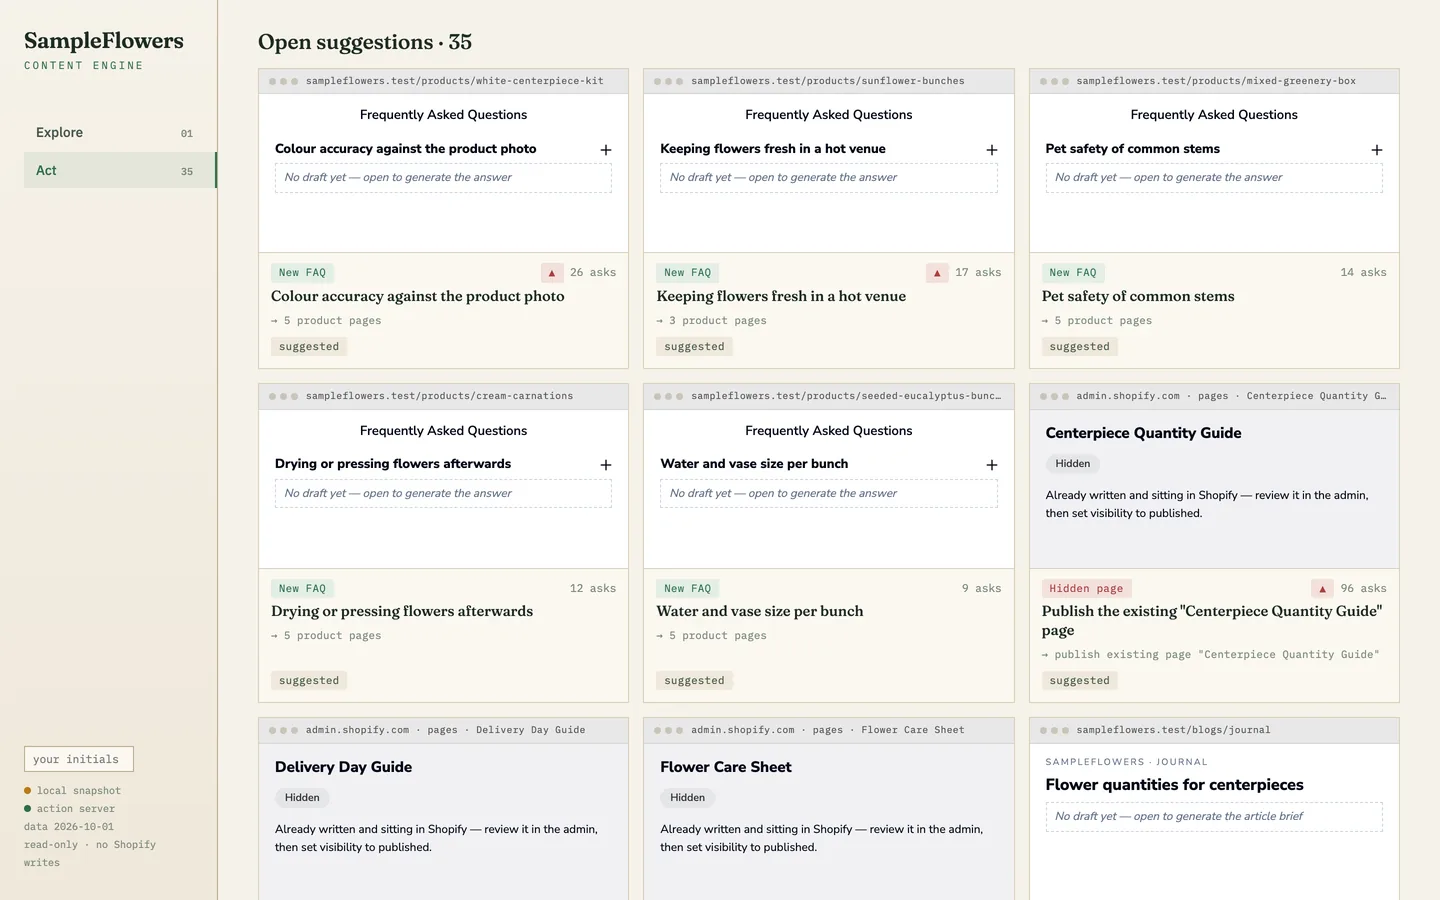
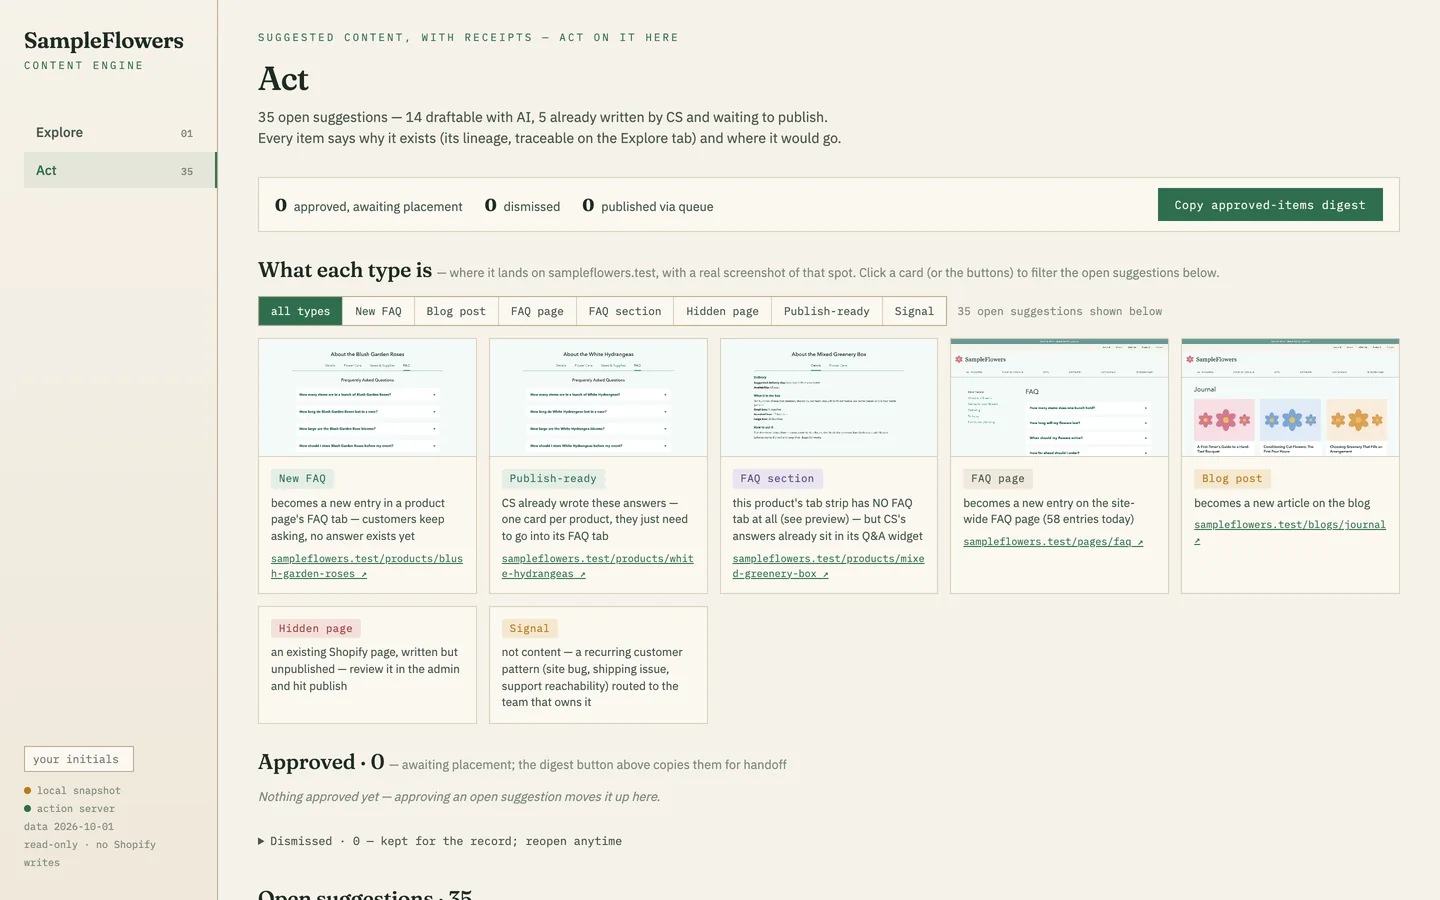
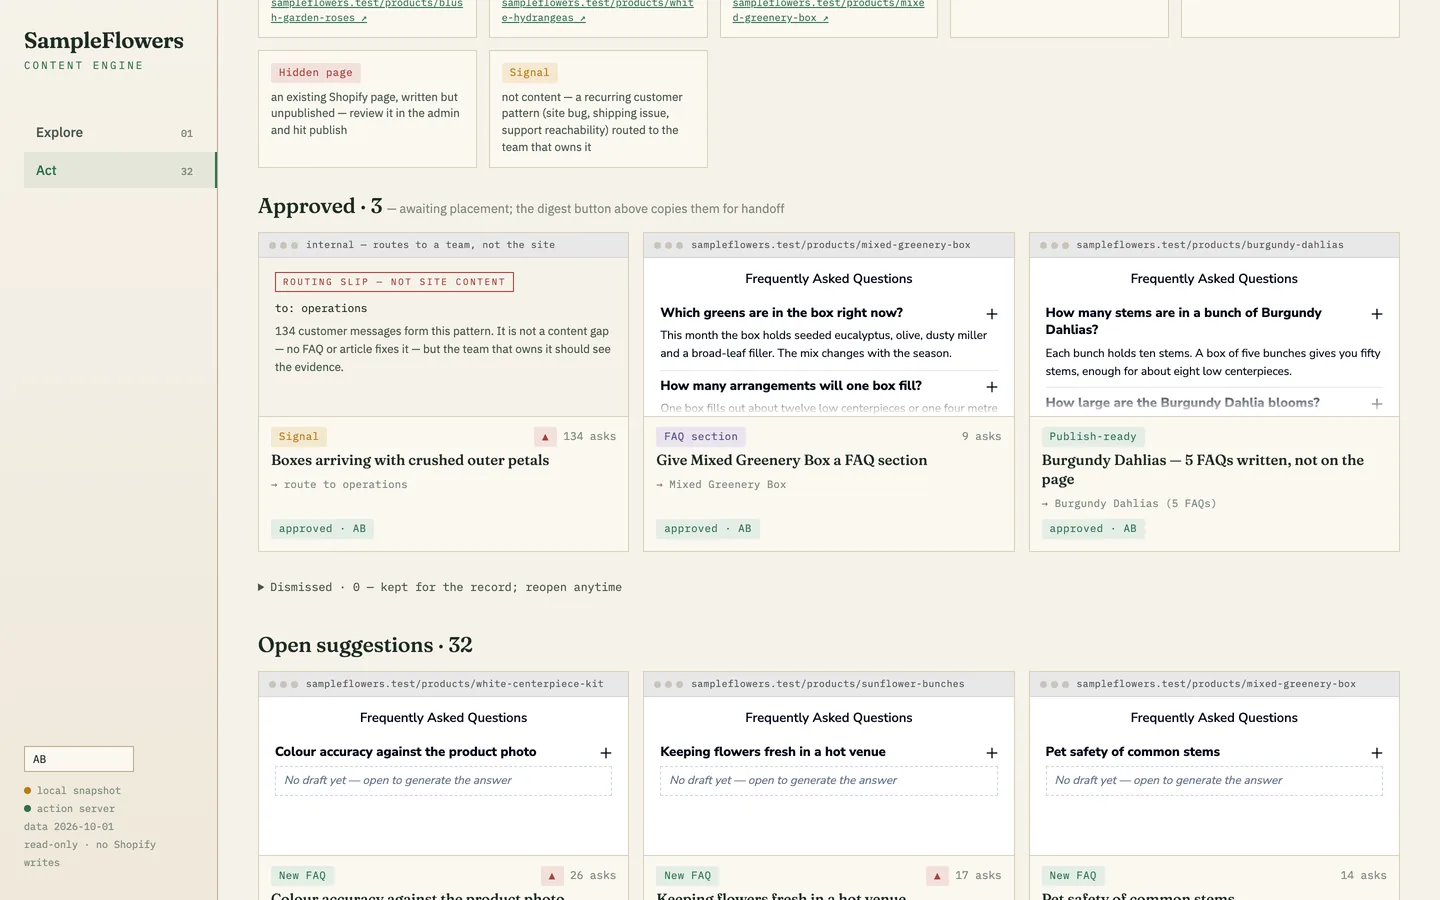
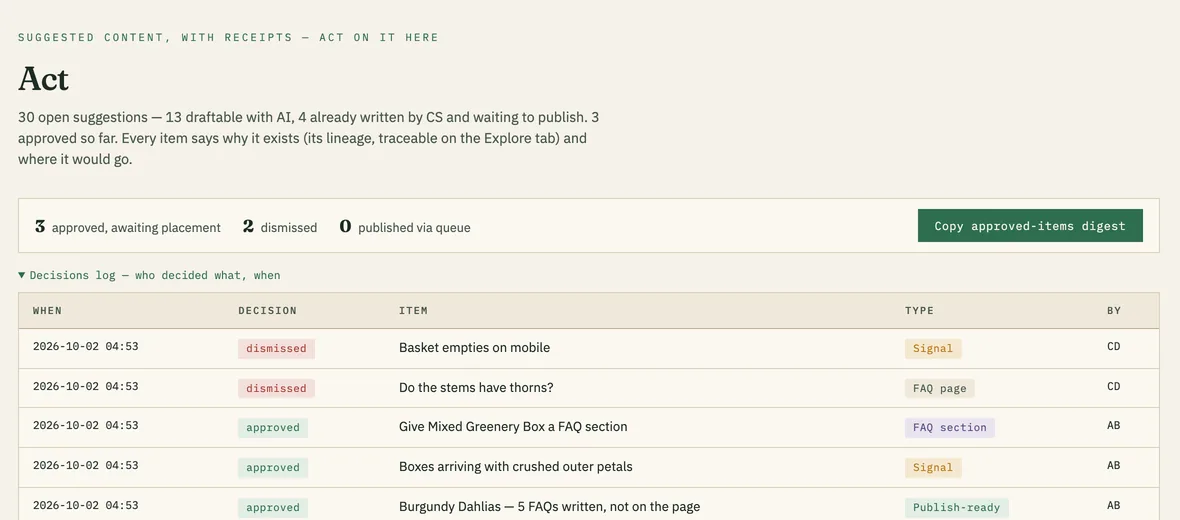
The review queue: each open suggestion drawn the way it would look where it lands. A local run of the dashboard’s own code with invented data for an invented shop.
The context
Customers ask the same questions in support conversations, on product pages and in reviews, while many of the answers sit in the support team’s saved replies or nowhere at all. Nobody could see which questions the website already answered and which it did not.
My contribution
Built the pipeline that gathers and classifies the questions, the matching that checks each topic against every place an answer can live, and a two-view dashboard: Explore for the evidence and Act for a review queue of suggestions with AI drafting on request. The queue was then rebuilt inside the company’s AI workspace. The work followed the AI discoverability research I delivered in March 2026.
The product
Three parts follow: the evidence, the review queue, and the pipeline behind them.
Support conversations, product-page questions, reviews and every existing answer go into one analysis database. Rules sort each support message, so only real customer questions enter the pool.
Similar questions are grouped into topics, and each topic is marked as FAQ material, a blog subject, or a problem that belongs to another team.
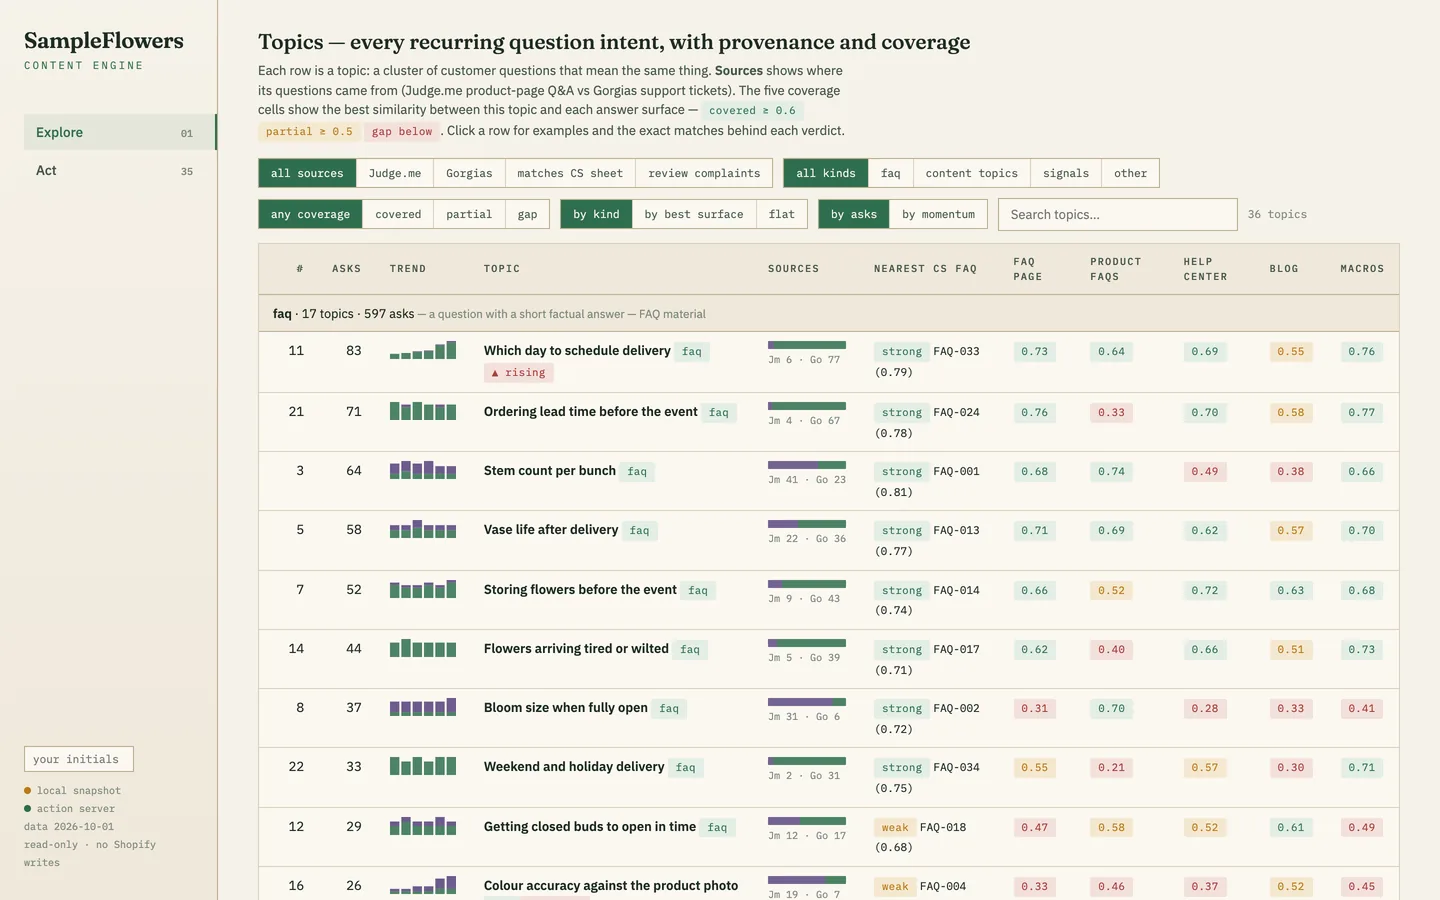
Each topic is compared with the FAQ page, product FAQs, the help center, the blog and the support team’s saved replies, so a gap is a measured gap.
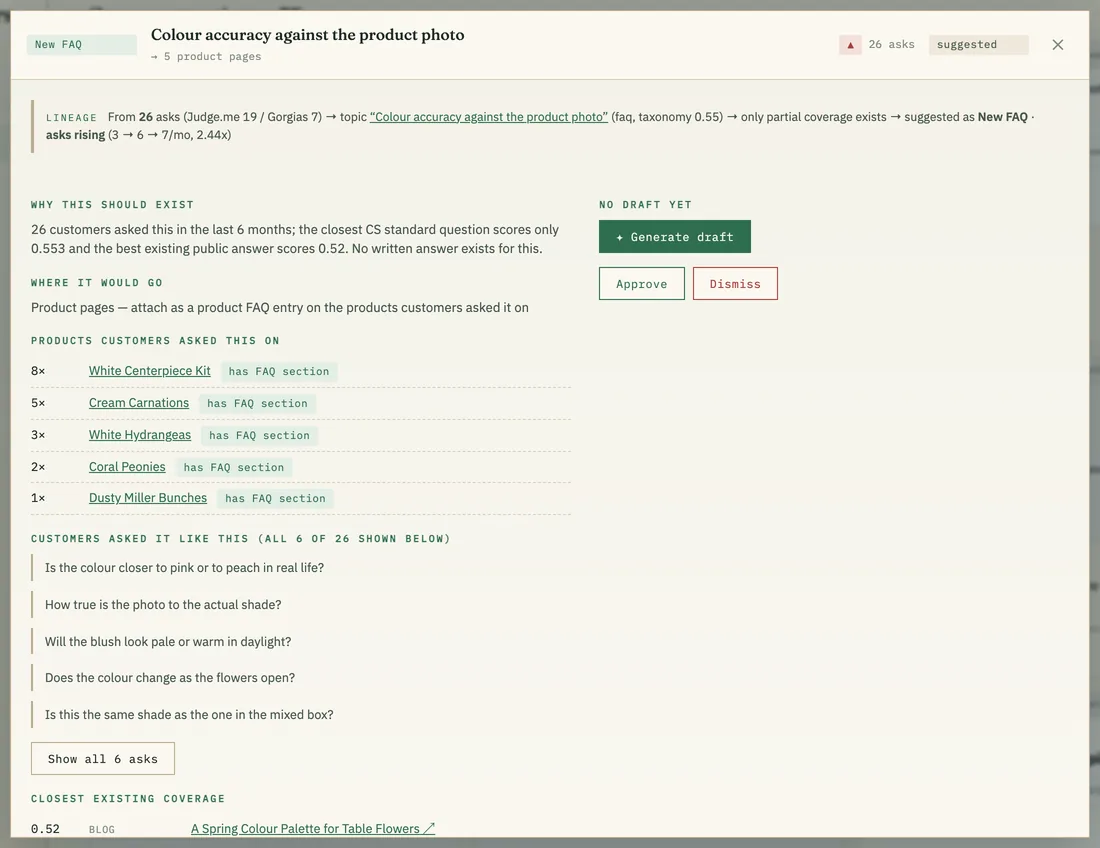
Each gap becomes a suggestion with its lineage: how many customers asked, how they worded it, the closest existing answer and the page it belongs on. Problems that content cannot fix are routed to the team that owns them.
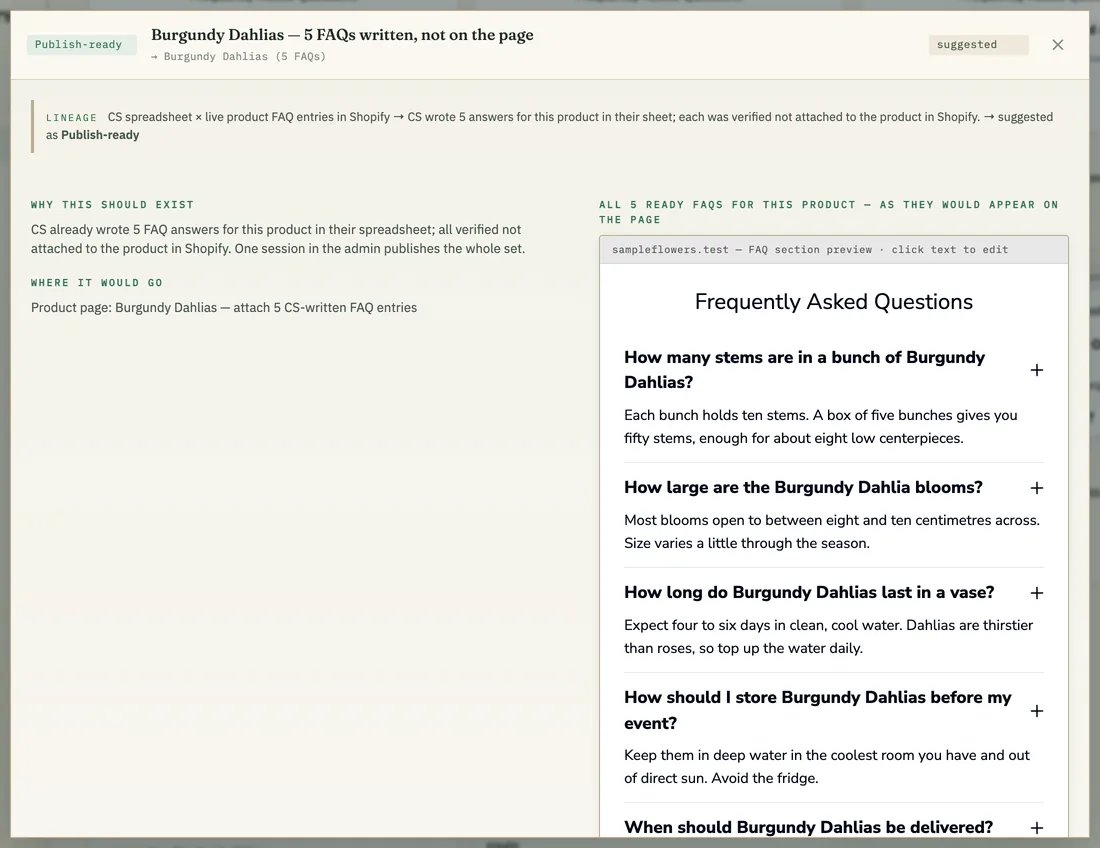
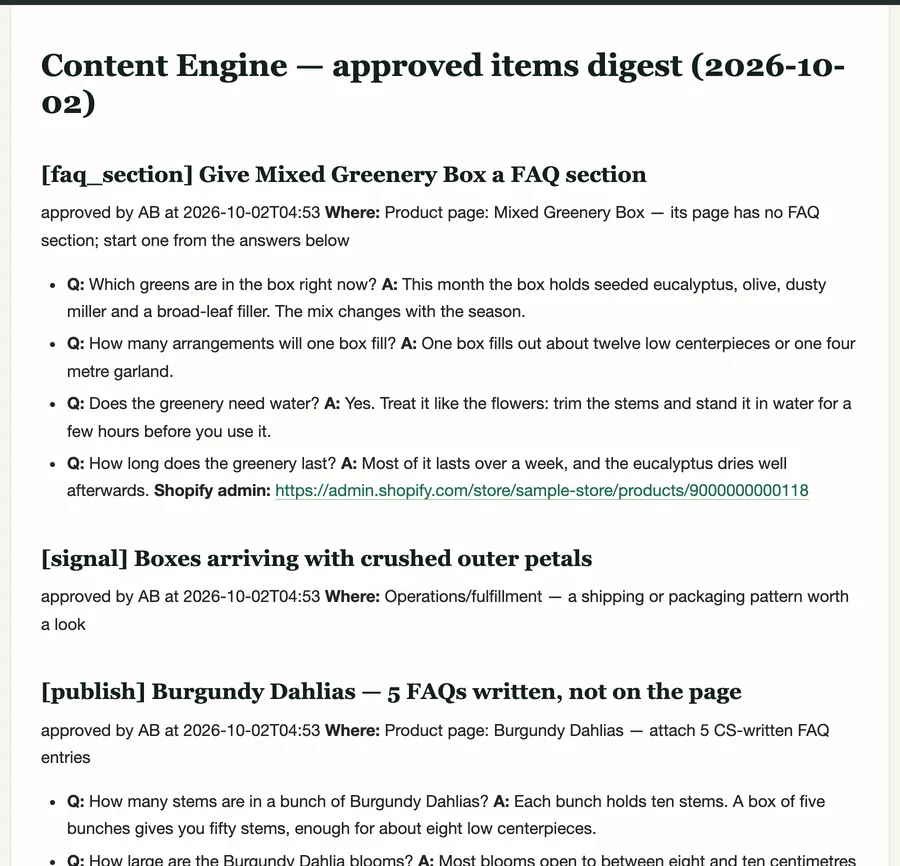
Reviewers approve or dismiss with their initials, and a digest hands the approved items to whoever places content in the store. Nothing is published automatically.
At a glance / simplified product view
The original dashboard · Explore
The original dashboard · June to September 2026
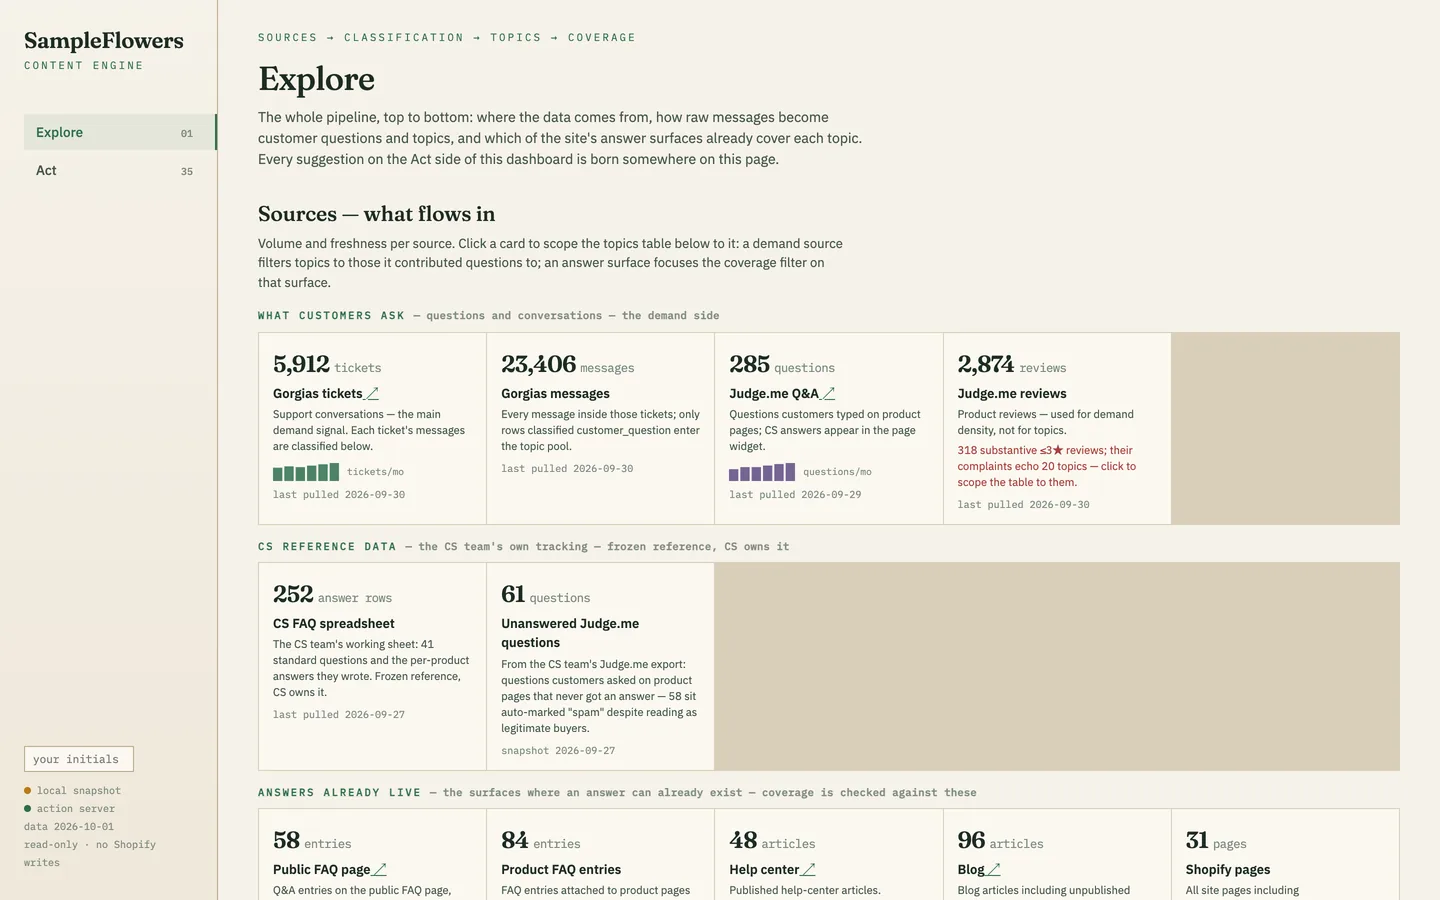
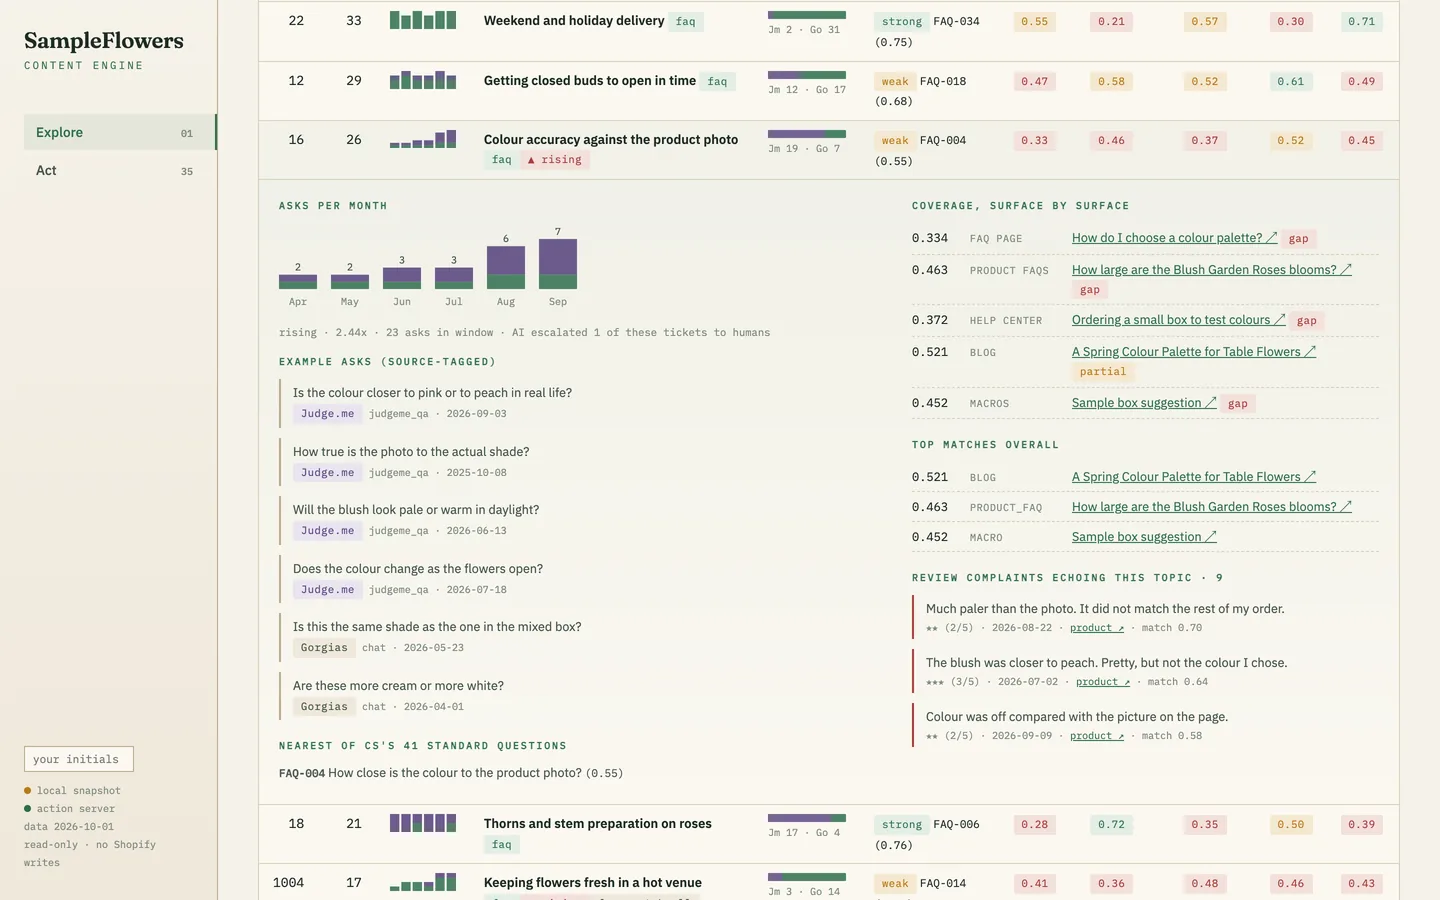
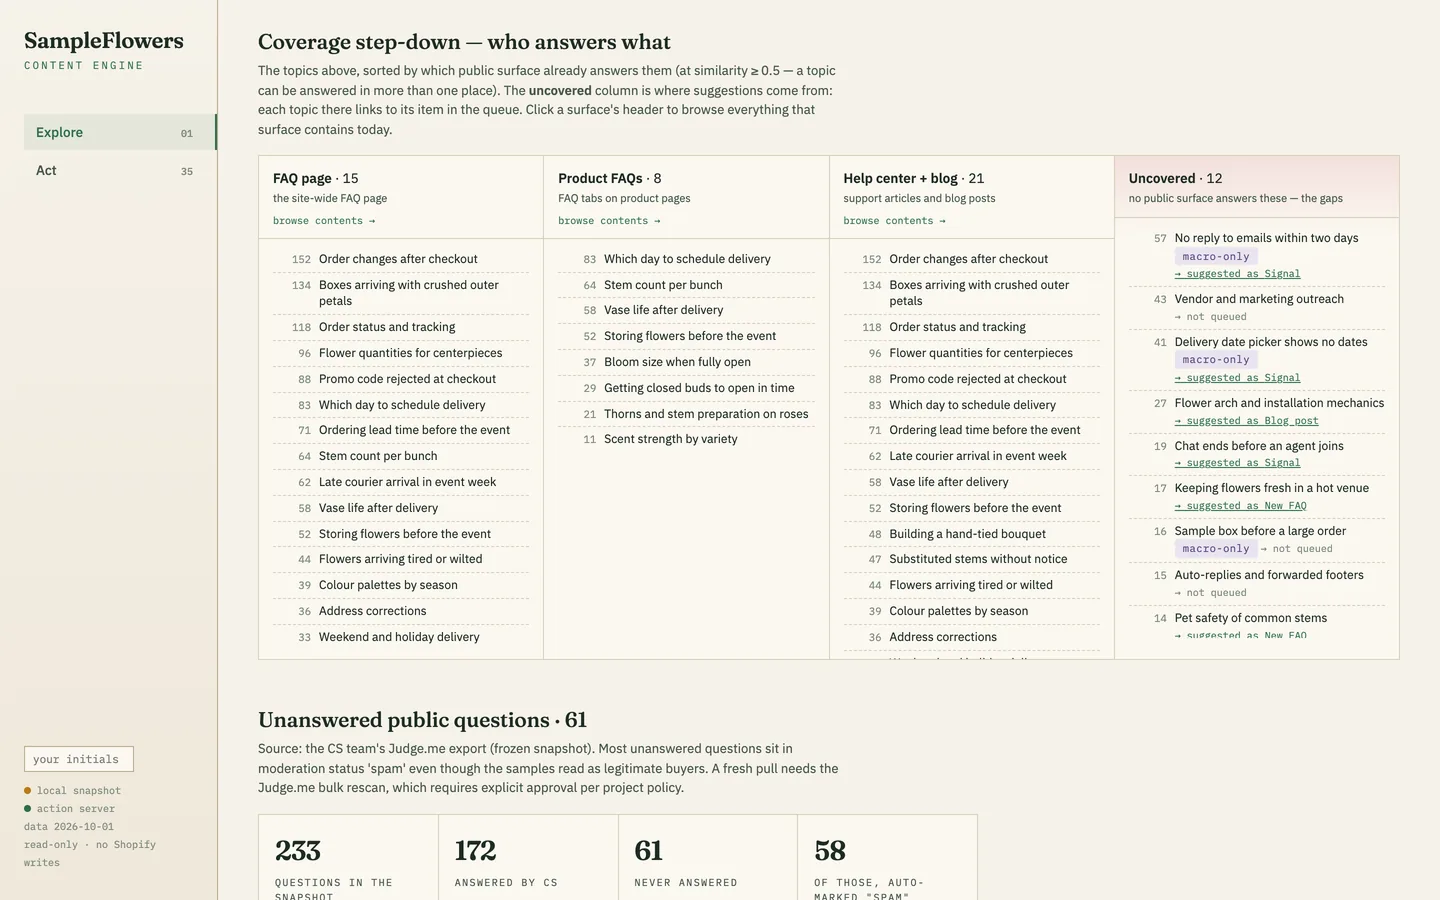
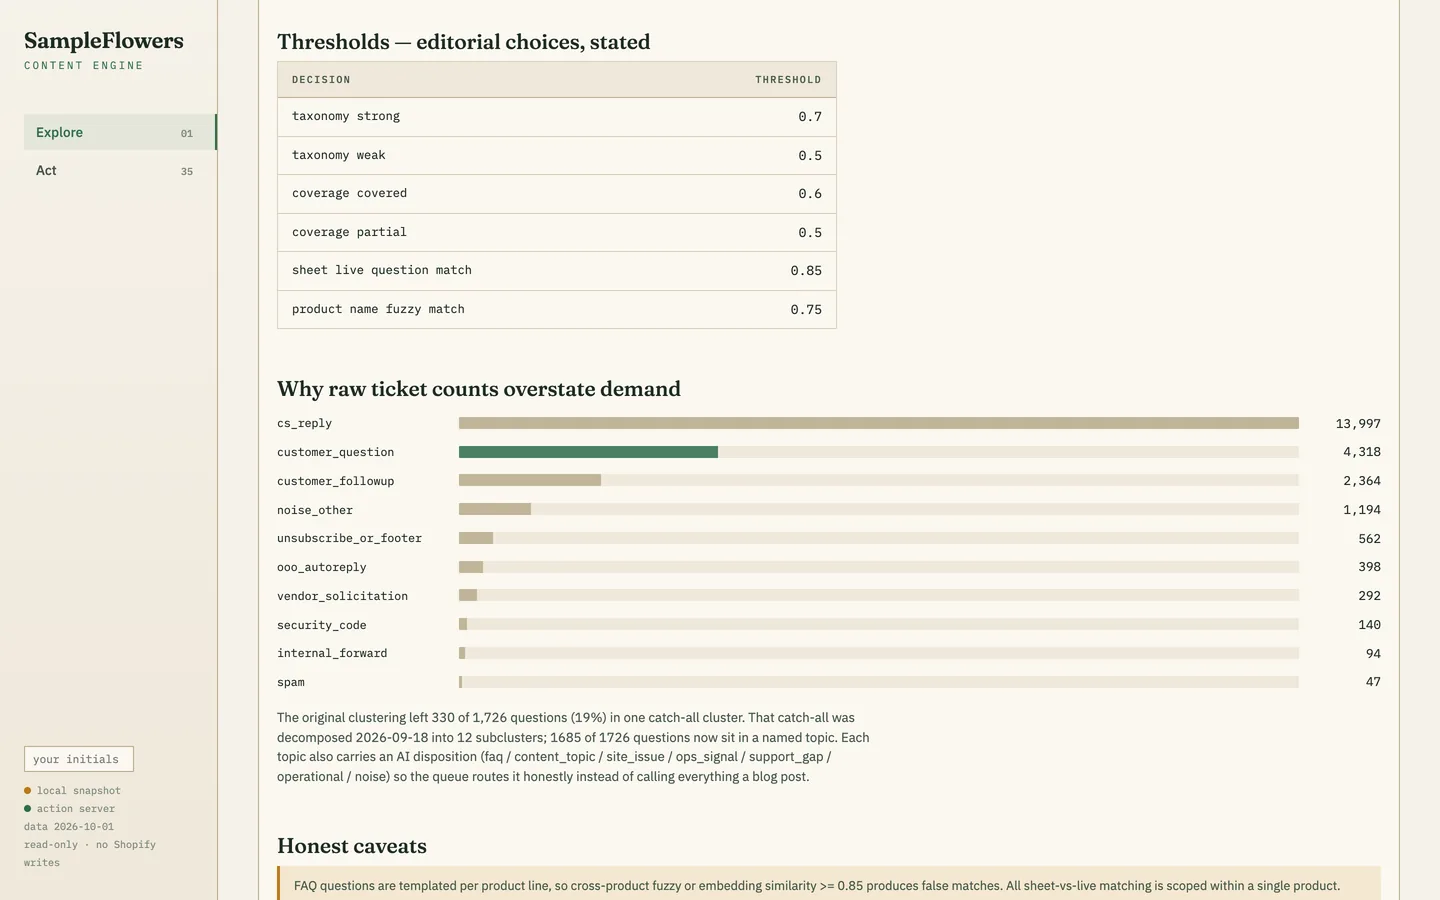
Explore is the whole pipeline on one page, top to bottom: where the data comes from, how raw messages become customer questions and topics, and which of the site’s answer surfaces already cover each topic. These pictures are the dashboard’s own code running on my machine with invented data for an invented shop, “SampleFlowers”. Every figure and every sentence of data is invented; the layout, the labels and the method text are the product’s. In the product a model names the topics; here the topic names are sample values.
The original dashboard · Act
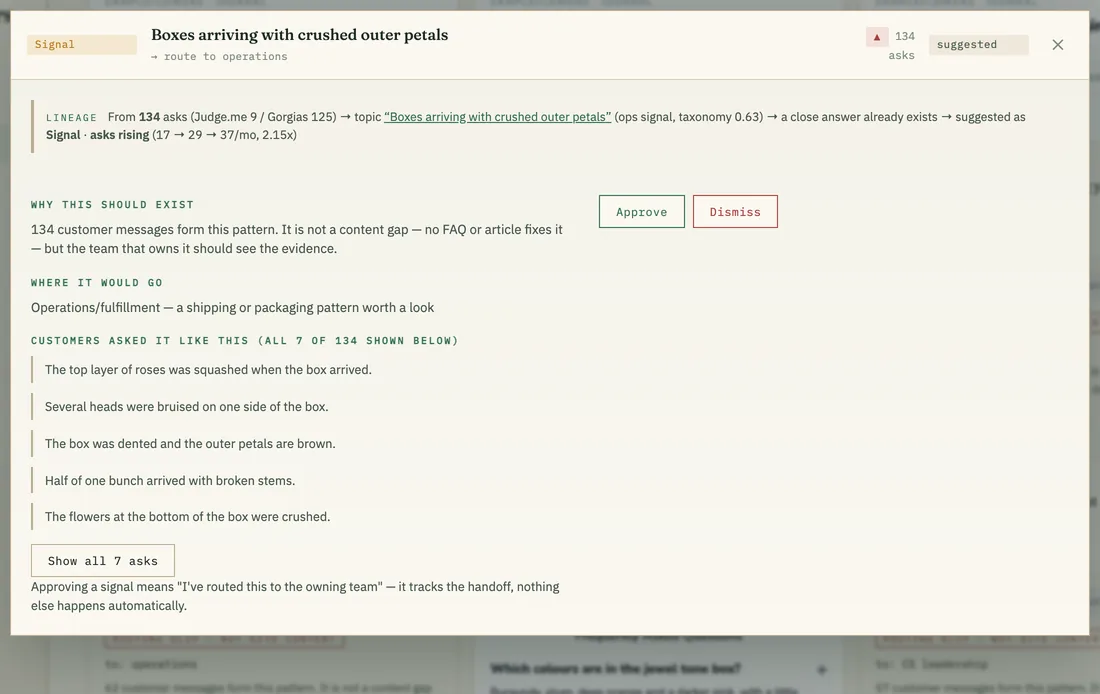
Act is the queue. Each suggestion comes from exactly one of seven rules and carries its receipts, so a reviewer can trace it back to the questions behind it. Reviewers approve or dismiss with their initials, and a digest hands the approved items on. The same queue was rebuilt inside the company’s AI workspace, where staff use it today. No AI draft appears in these pictures: none was requested in this run.
Behind the dashboard
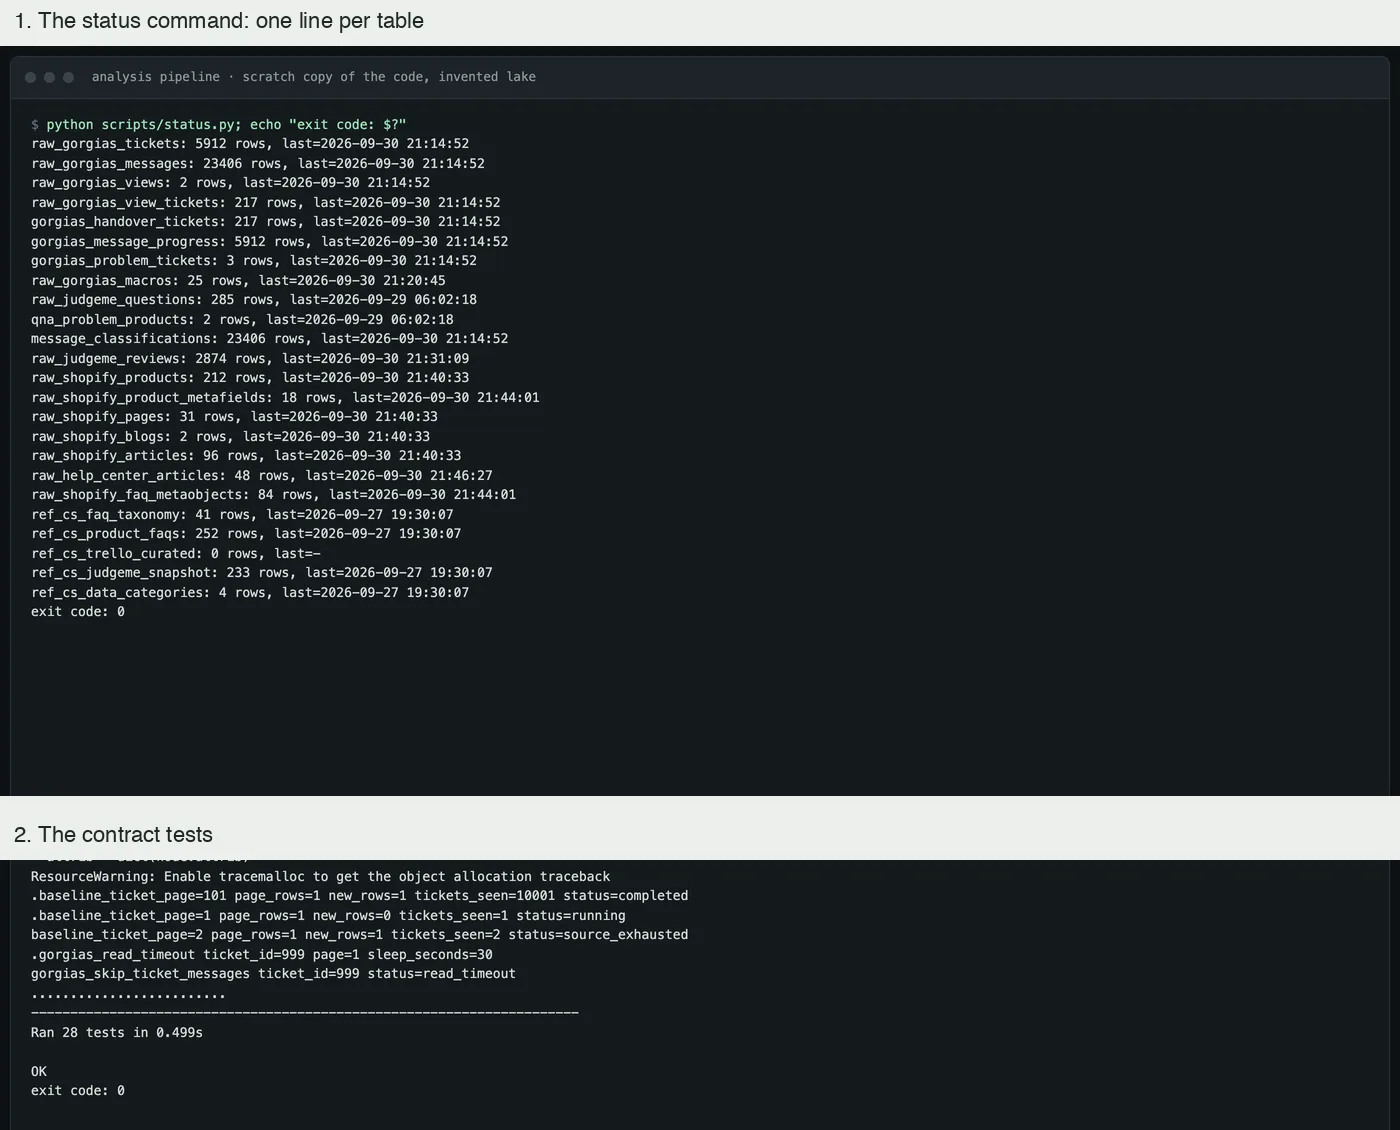
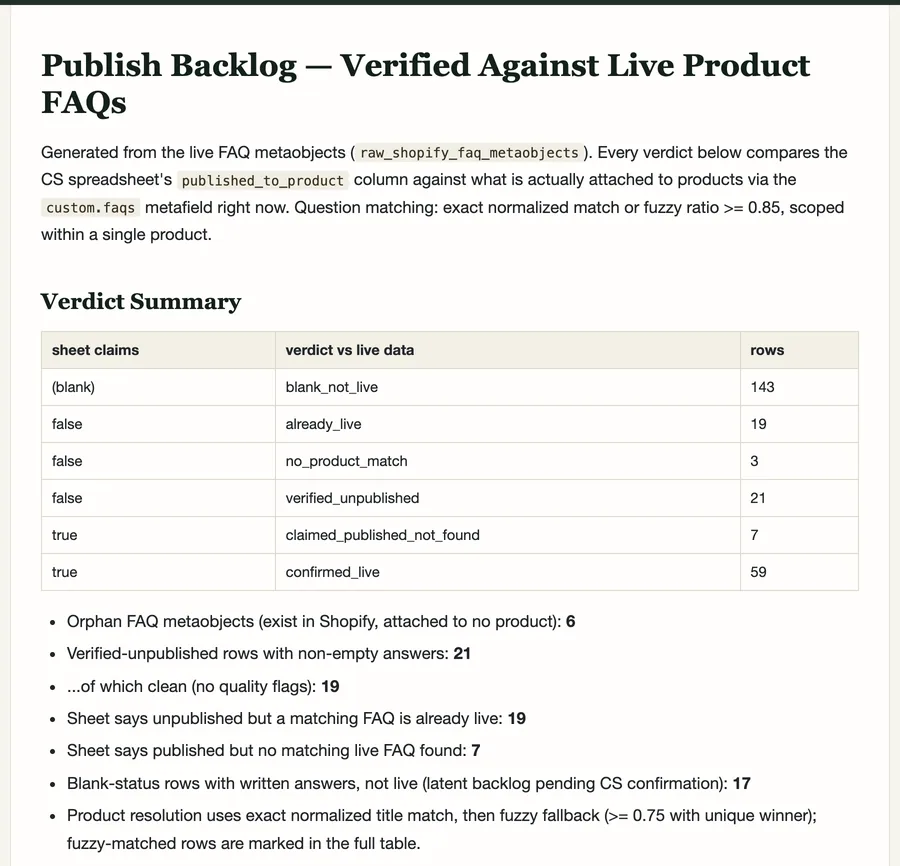
The dashboard reads a snapshot written by a pipeline of plain commands over one analysis database. These pictures are the pipeline’s own commands and report code run on my machine against an invented database sized to match the sample dashboard.
Engineering choices
A recurring shipping or website problem becomes a signal for the team that owns it, not a blog post.
Every matching threshold is listed on the page as an editorial choice, beside the caveats, so a reviewer can judge a suggestion instead of trusting it.
A model names each topic and writes a draft only when asked. Sorting the messages is rule-based, and matching uses text similarity with stated thresholds.
Where it stands
The review queue has been in the company’s AI workspace since June 2026, showing the June 2026 analysis. The original dashboard, which saved decisions for the whole team and drafted on request, was retired in September 2026. Bringing shared decisions and drafting into the workspace, refreshing the data and getting the first approved answers onto the site are the next steps; no content has been published through the queue yet.
Same company
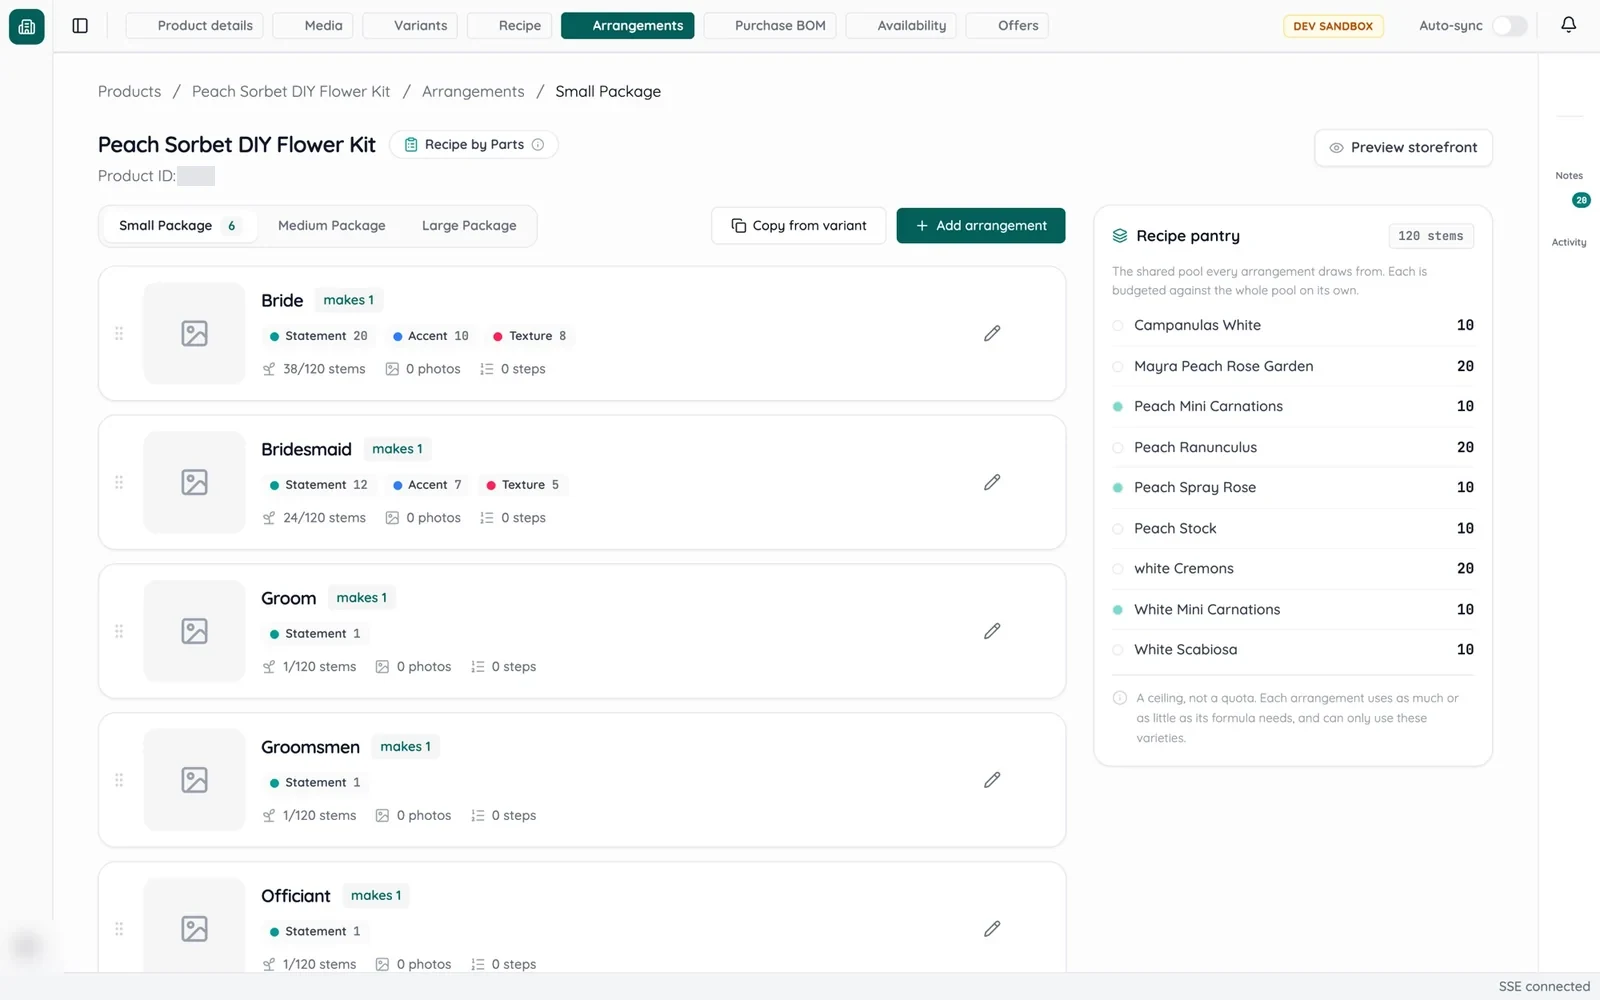 DIY kit data migrationDelivered on a test copy of the store
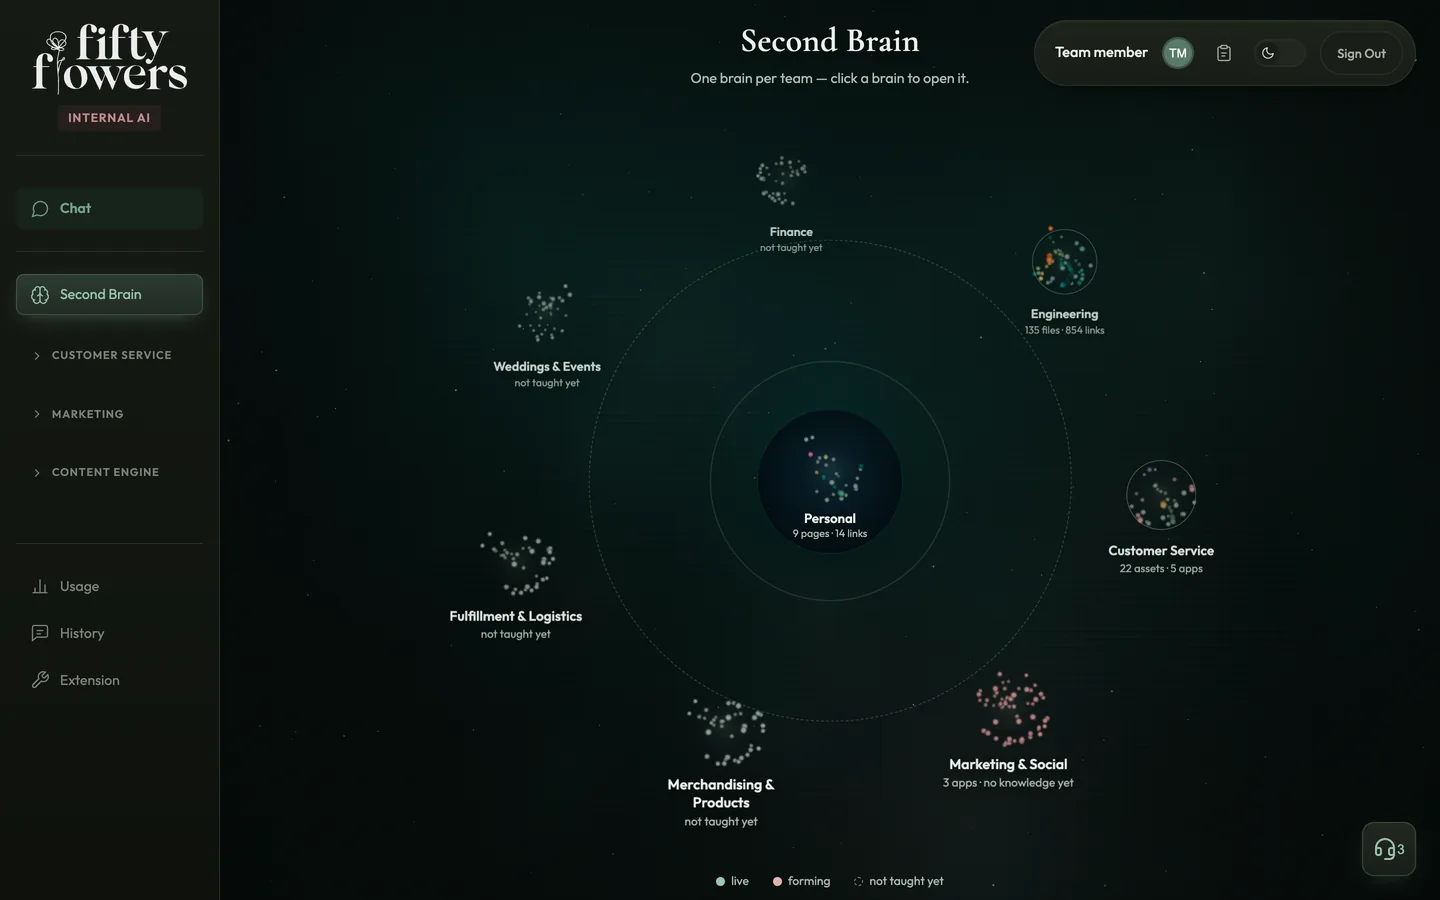 Company Second BrainMVP · live since July 2026, two of seven team brains filled
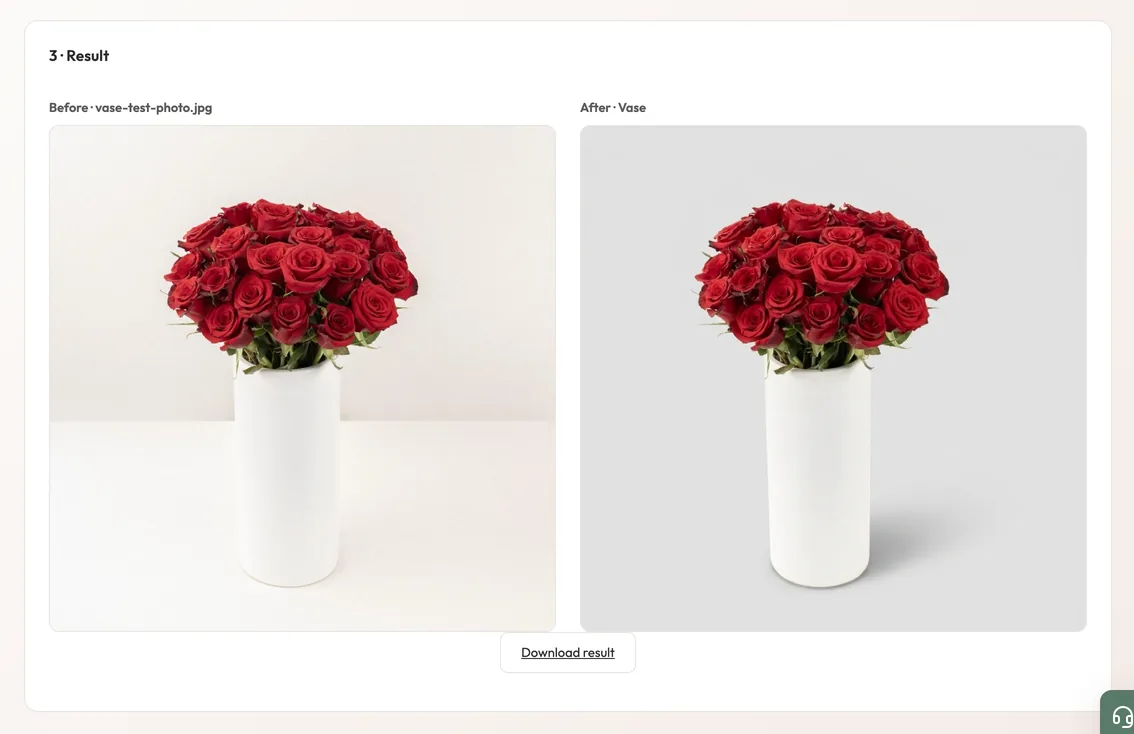 Image StudioIn production · released August 2026
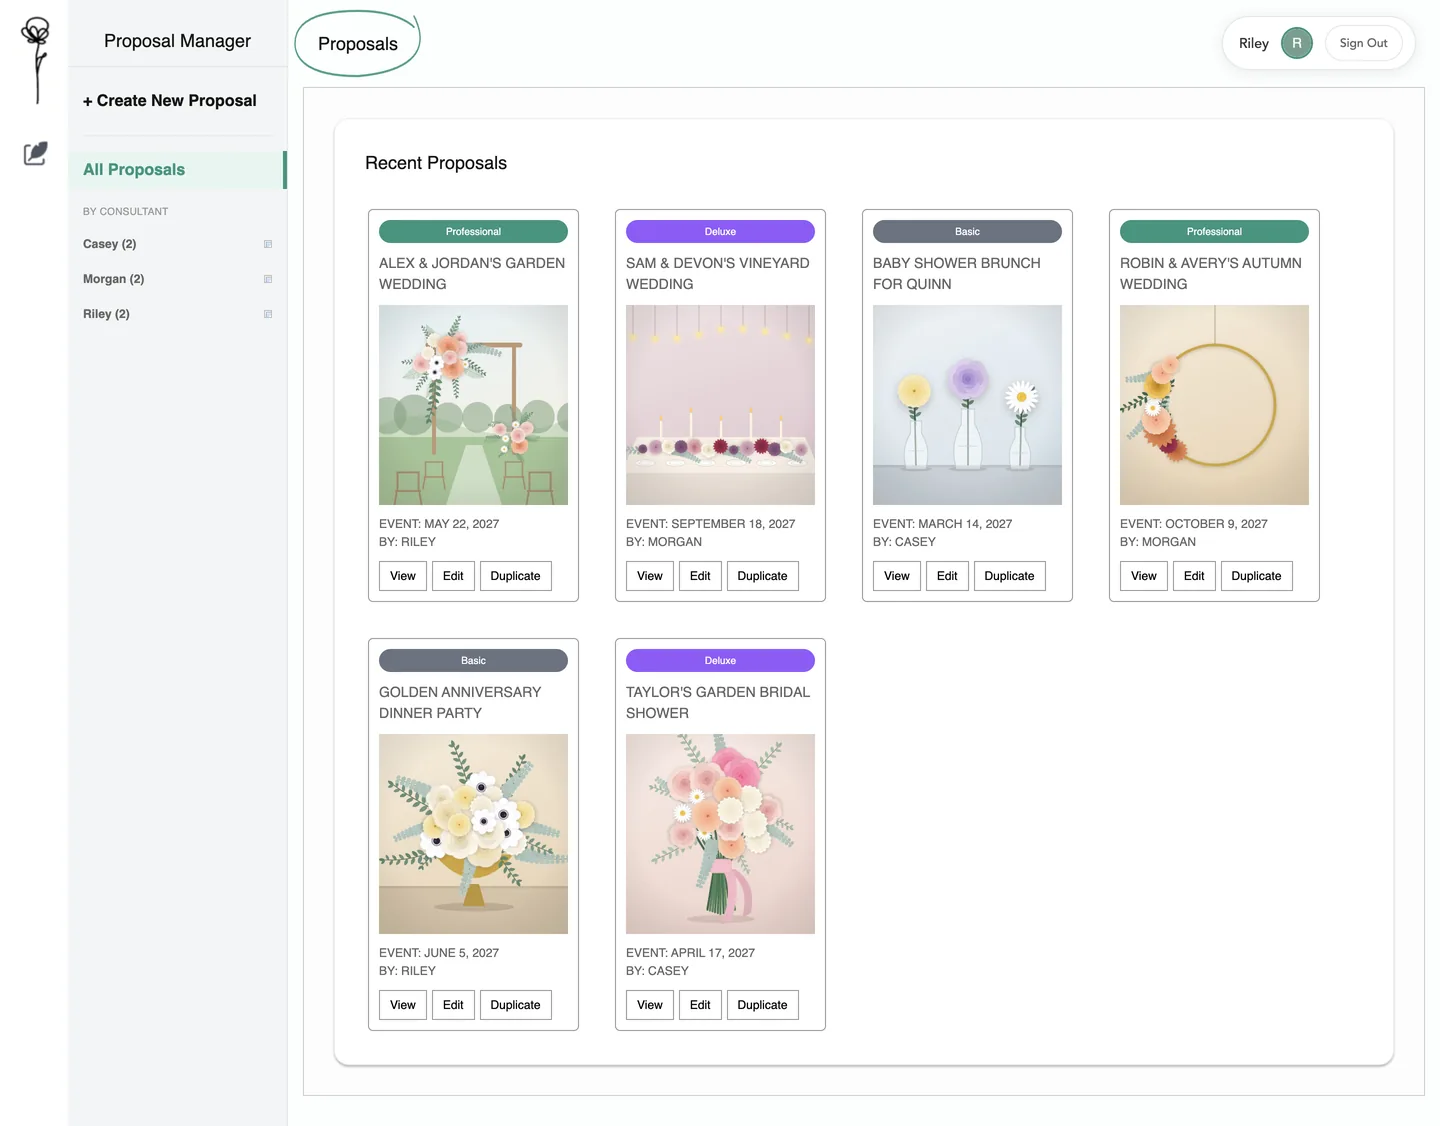 Proposal ManagerBuilt from the team’s wireframes · not launched
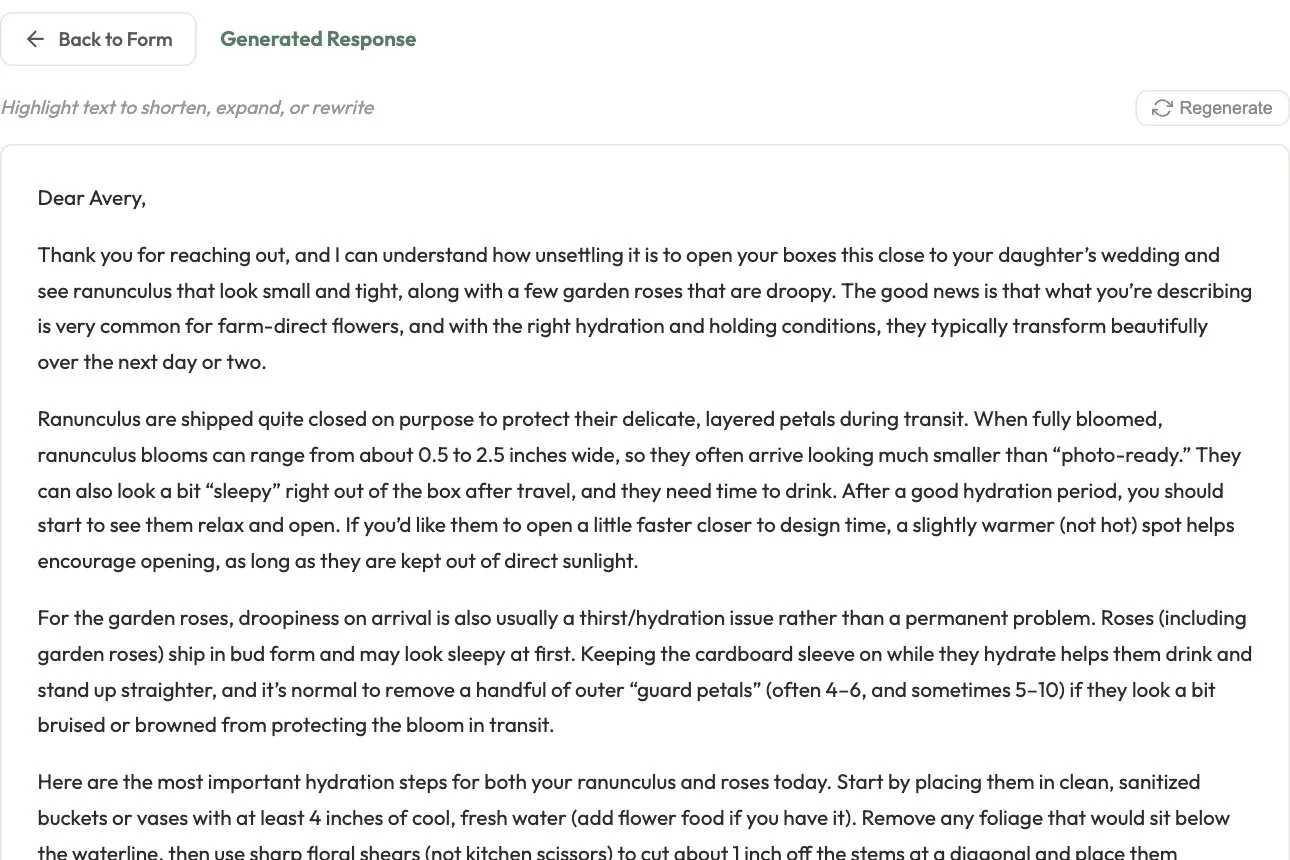 Customer service AIIn production · since January 2026
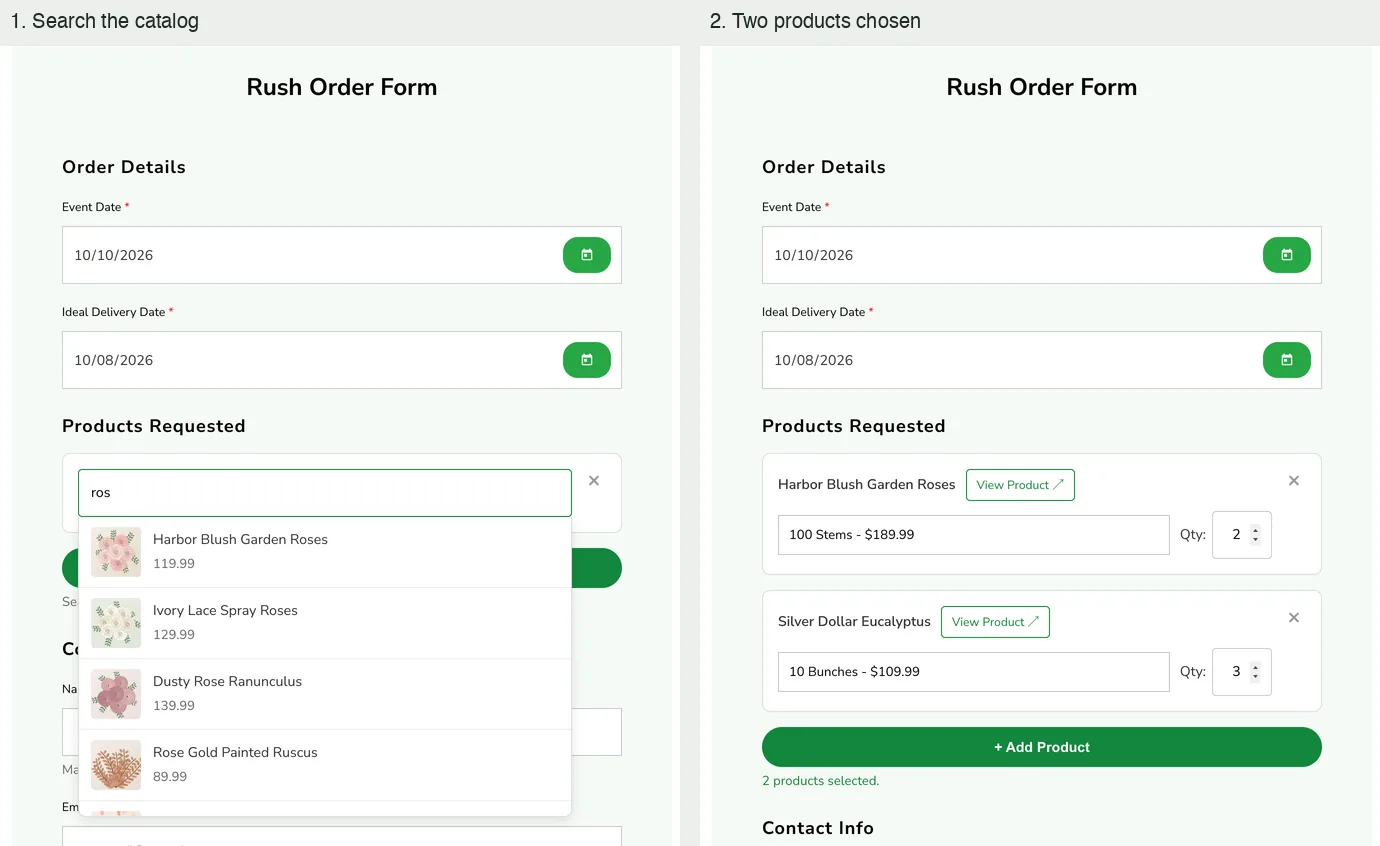 Storefront requestsRush form live · contest processing run on 2025 entries
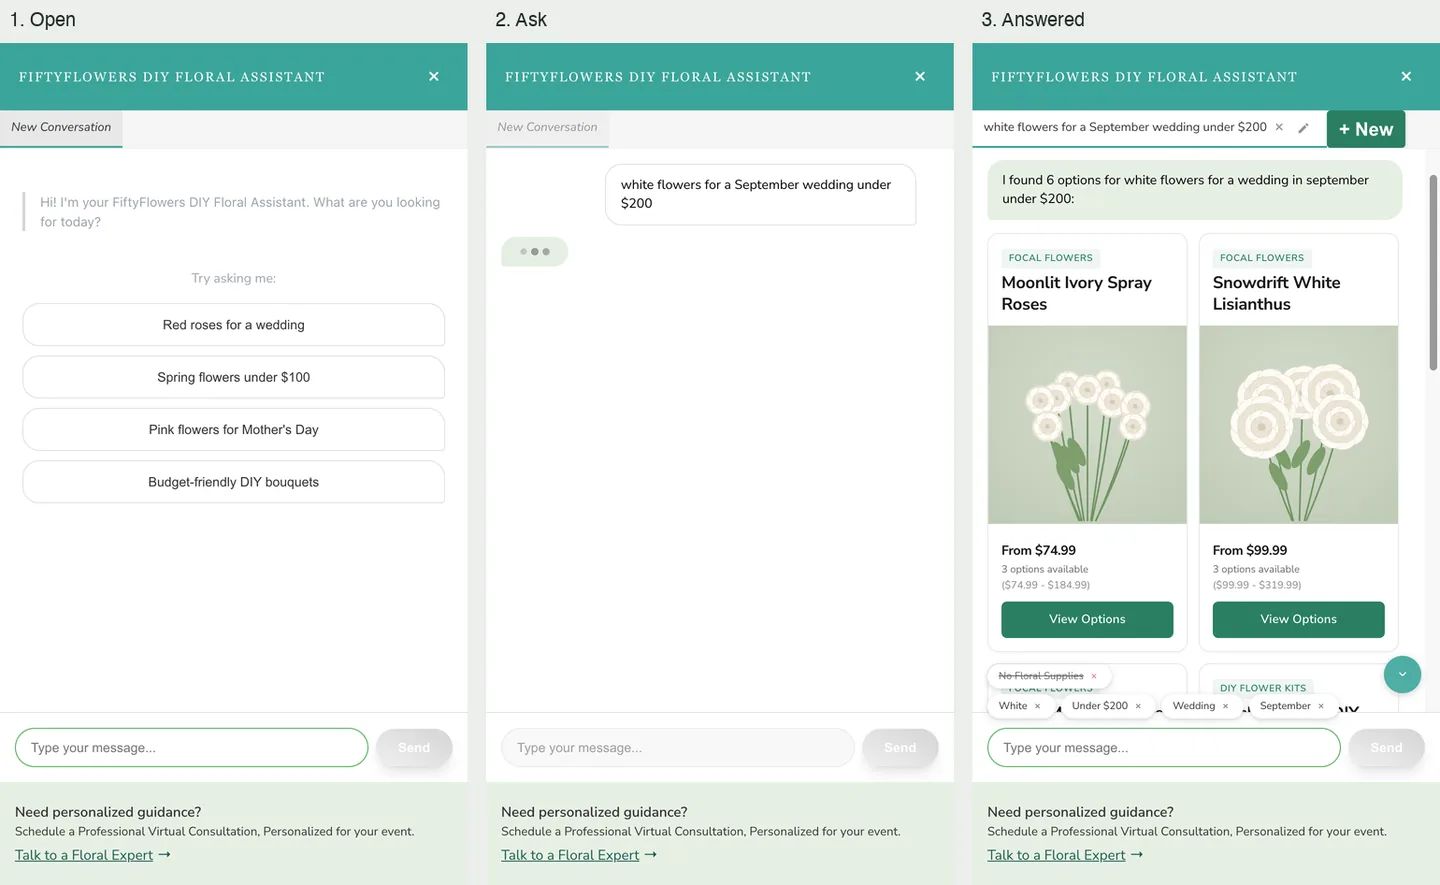 AI Floral AssistantIn the store theme · behind an A/B test since January 2026