← All work

Structural engineering

Axiom

Make past engineering work useful again.

AI-assisted extraction turned thousands of historical fee proposals into a searchable research workspace, with fee-estimating tools on top. Led delivery with subcontracted development.
PROJECTAxiom
MY ROLEProject direction & subcontractor management
STAGEDelivered with development partners · estimates not yet validated
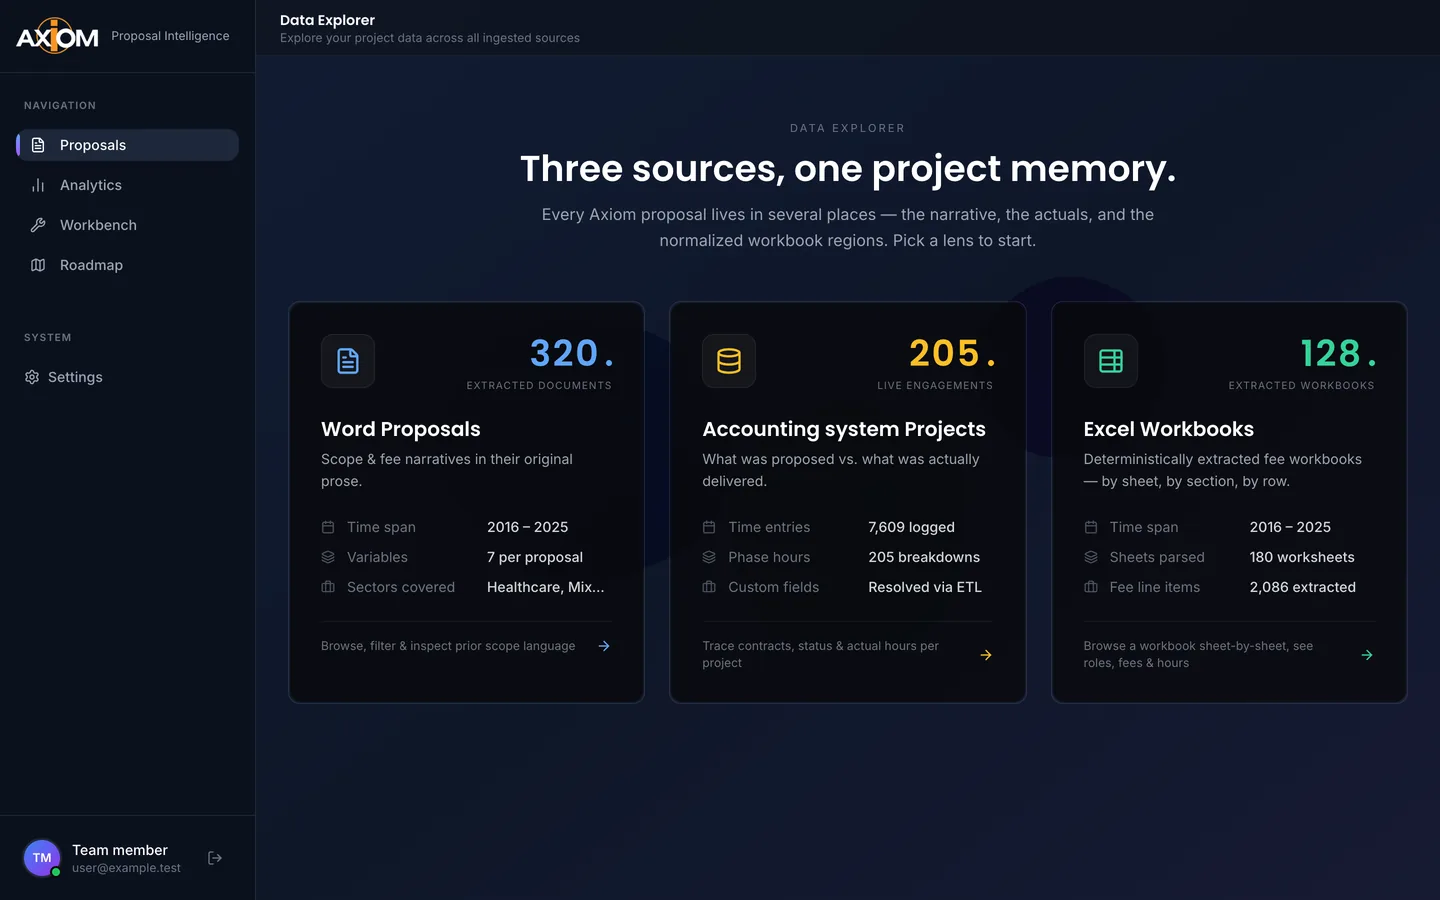
A dark dashboard page with three cards for Word proposals, accounting projects and Excel workbooks

The research workspace’s landing page: three sources of project history. A local run of the product’s code with invented records.

The context

A problem worth solving.

Useful estimating context was buried in historical Word proposals, Excel fee workbooks and project-accounting records. AI-assisted extraction makes that information available for research and comparison.

My contribution

What I brought to the work.

Led the engagement through Manifold Engineering, directing the project and managing subcontracted development. Collaborating developers implemented the dashboard and its research tools.

The product

What it makes possible.

Five parts follow: the three sources, how a workbook is read, analytics, the estimating workbench, and a separate briefing prototype.

01

Proposal research

AI-assisted extraction makes historical Word proposals and Excel fee workbooks searchable and usable in the dashboard, beside project-accounting records.

02

Estimating context

Explore historical fees and hours to inform estimates for new projects. The figures are a starting point for an engineer’s judgment, not a quote.

03

Executive briefing

A separate executive-briefing exploration, distinct from the research dashboard. It was not launched.

At a glance / simplified product view

  1. 01Proposal history
  2. 02Search & explore
  3. 03Estimating context

The research workspace

Proposal history you can search, with the evidence kept.

Delivered with development partners · estimates not yet validated

The workspace brings three kinds of history together: the proposals themselves, the project records from the accounting system, and the Excel fee workbooks. Collaborating developers implemented the dashboard under my direction. These pictures are its own code running on my machine with invented records: no real project, client, person or figure appears, and the name of the client’s accounting system is replaced by a neutral phrase.
A dark dashboard page with three cards for Word proposals, accounting projects and Excel workbooks
Three sources, one project memoryThe landing page: Word proposals, the accounting system’s projects and Excel fee workbooks, each with what it holds and a way in. Local run, invented records.
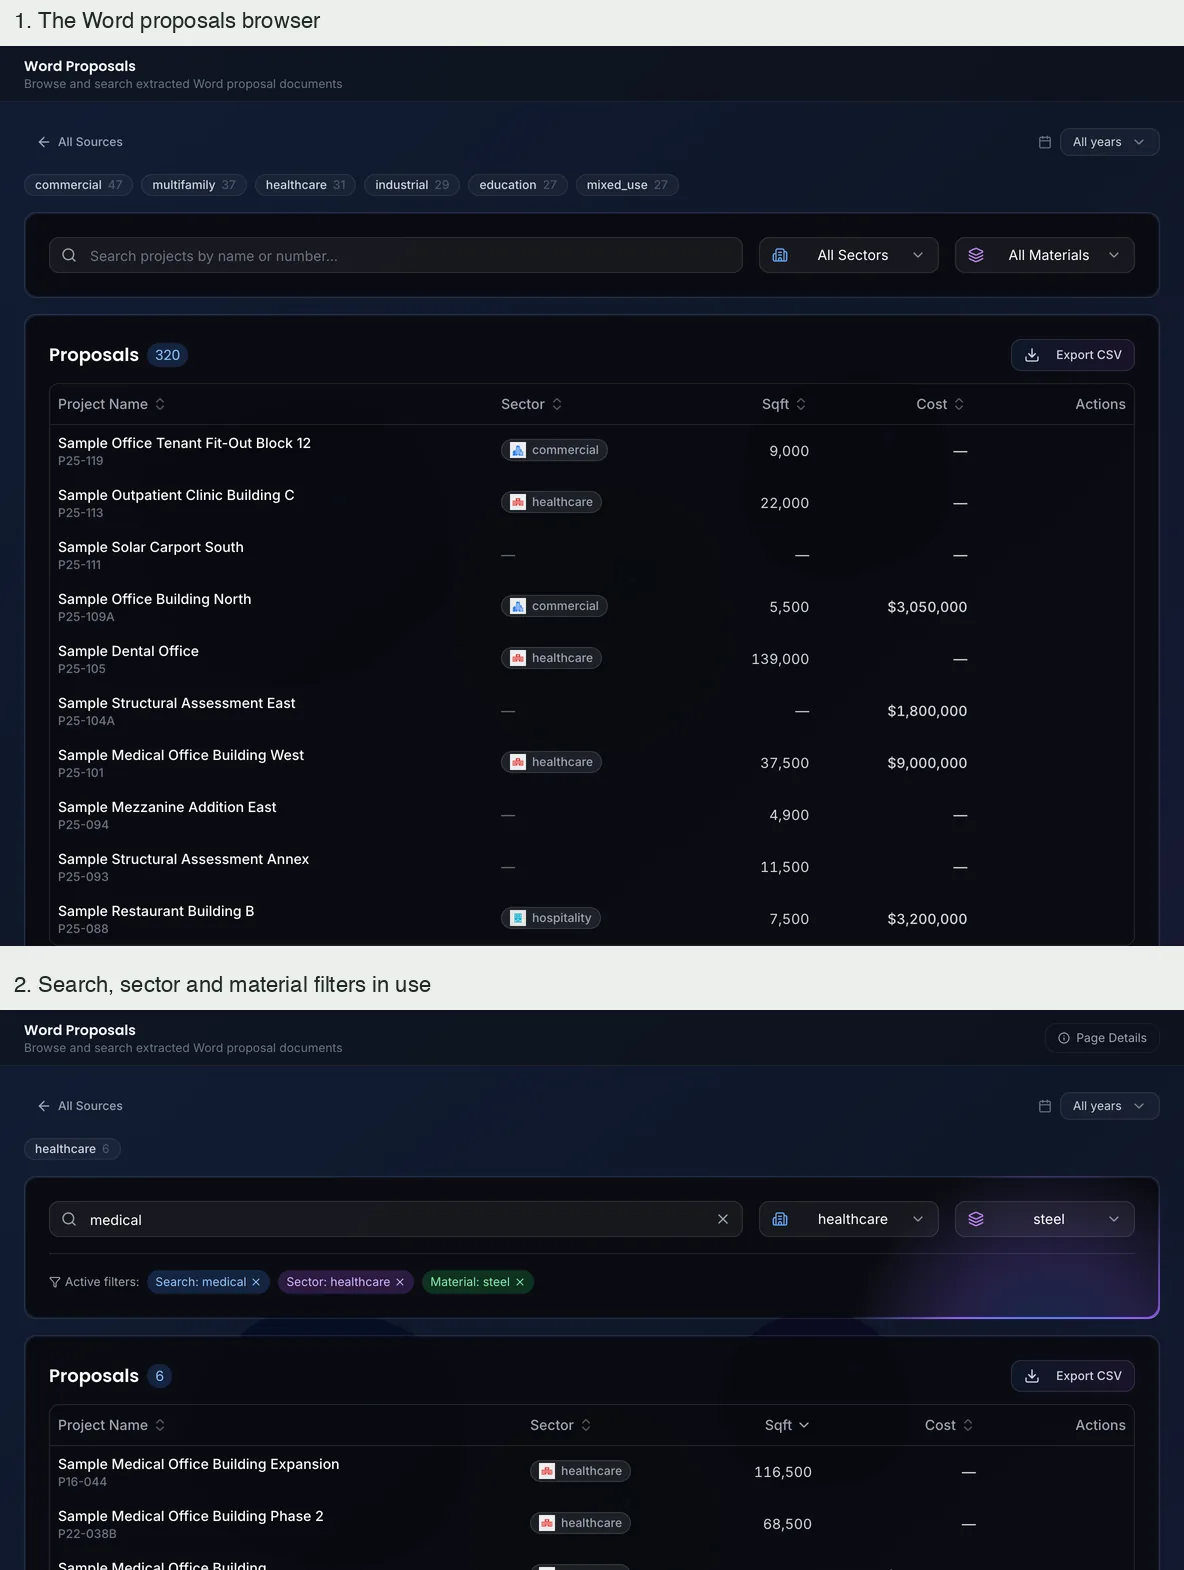
A table of proposals with sector chips and filters, then the same table filtered to six rows
Proposals you can searchThe table of extracted proposals, and the same table narrowed by a search word, a sector and a material. Local run, invented records.
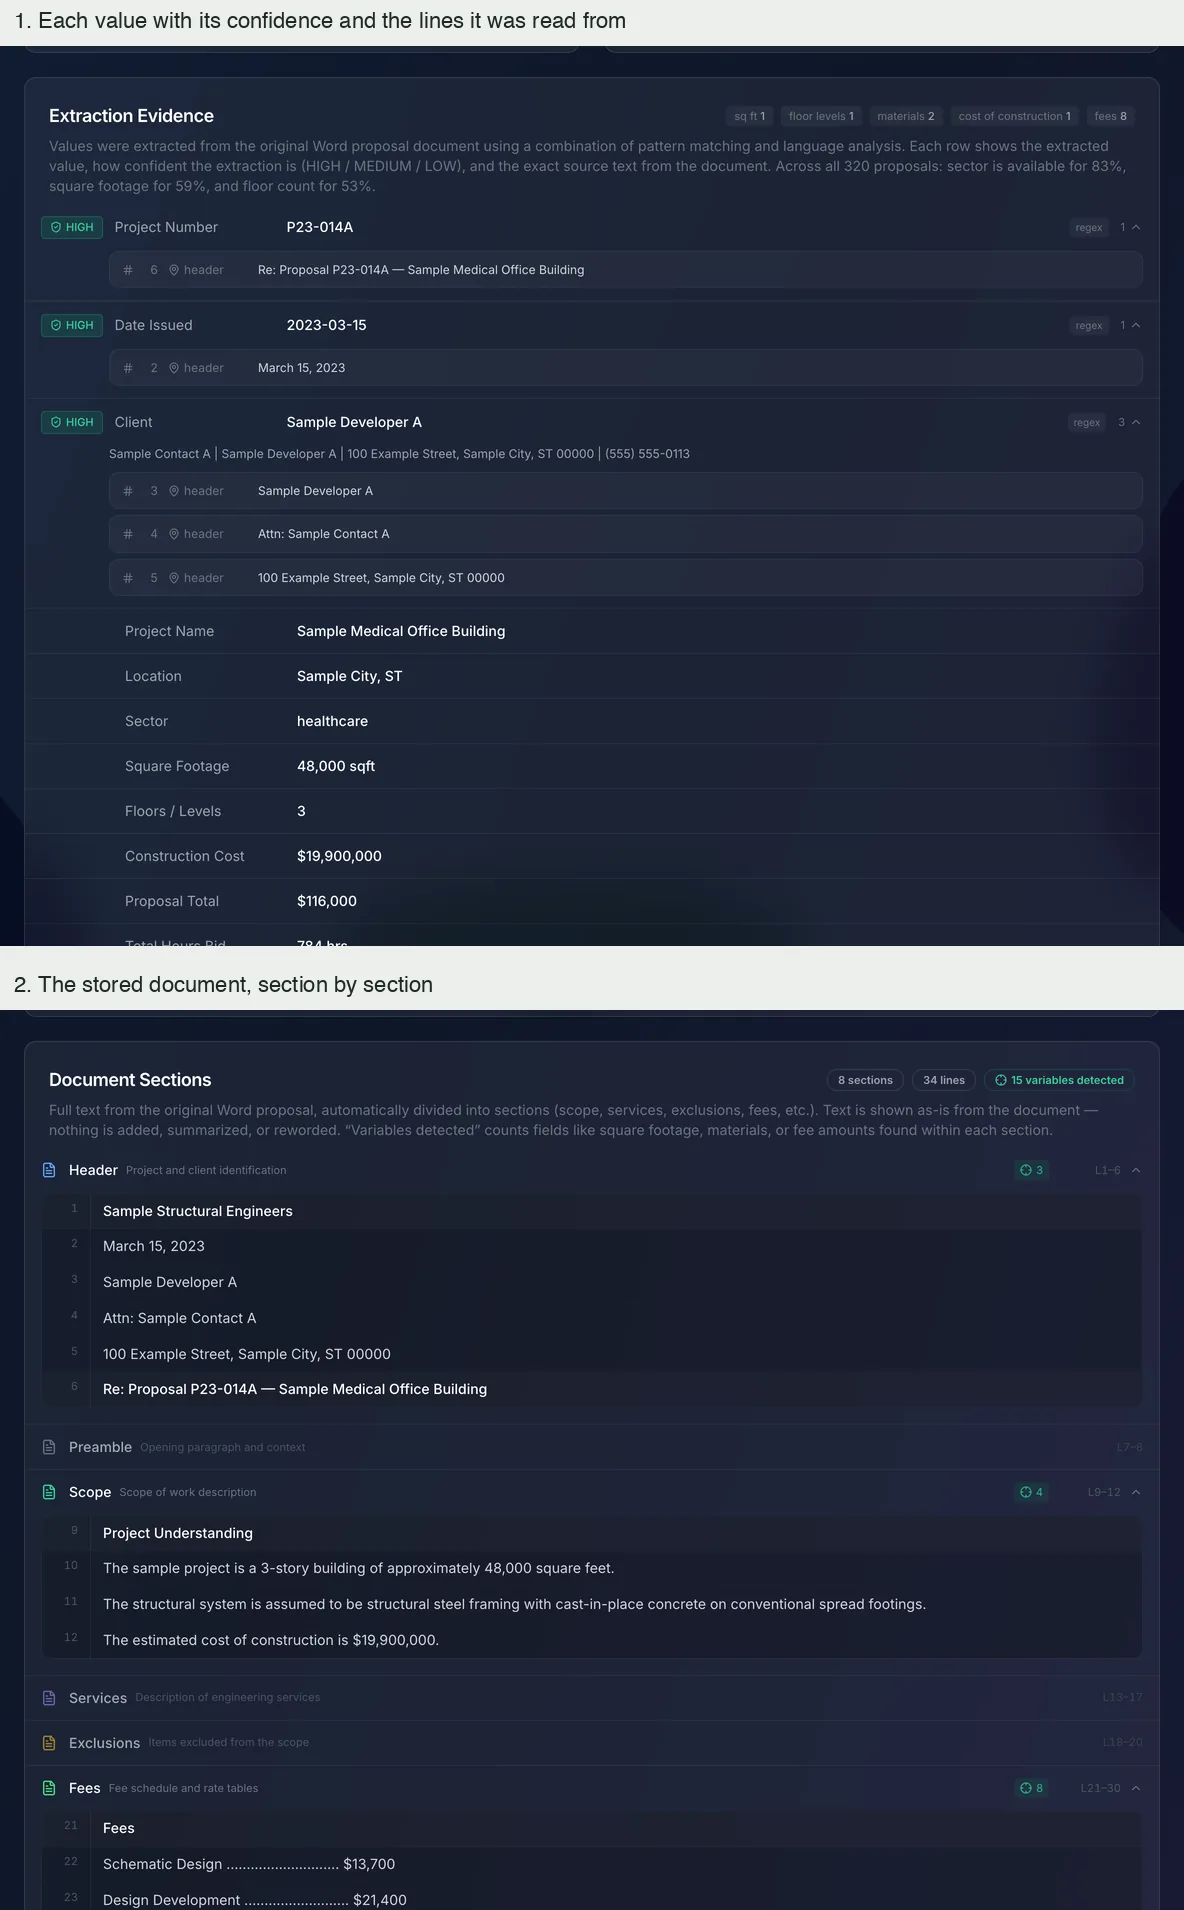
Extraction evidence rows with confidence badges, then a document divided into sections
Every value keeps its evidenceEach extracted value carries a confidence level and the lines of the document it was read from; the document itself is kept in sections. Local run, invented records.
A fee breakdown with a phase bar, and an extraction quality card
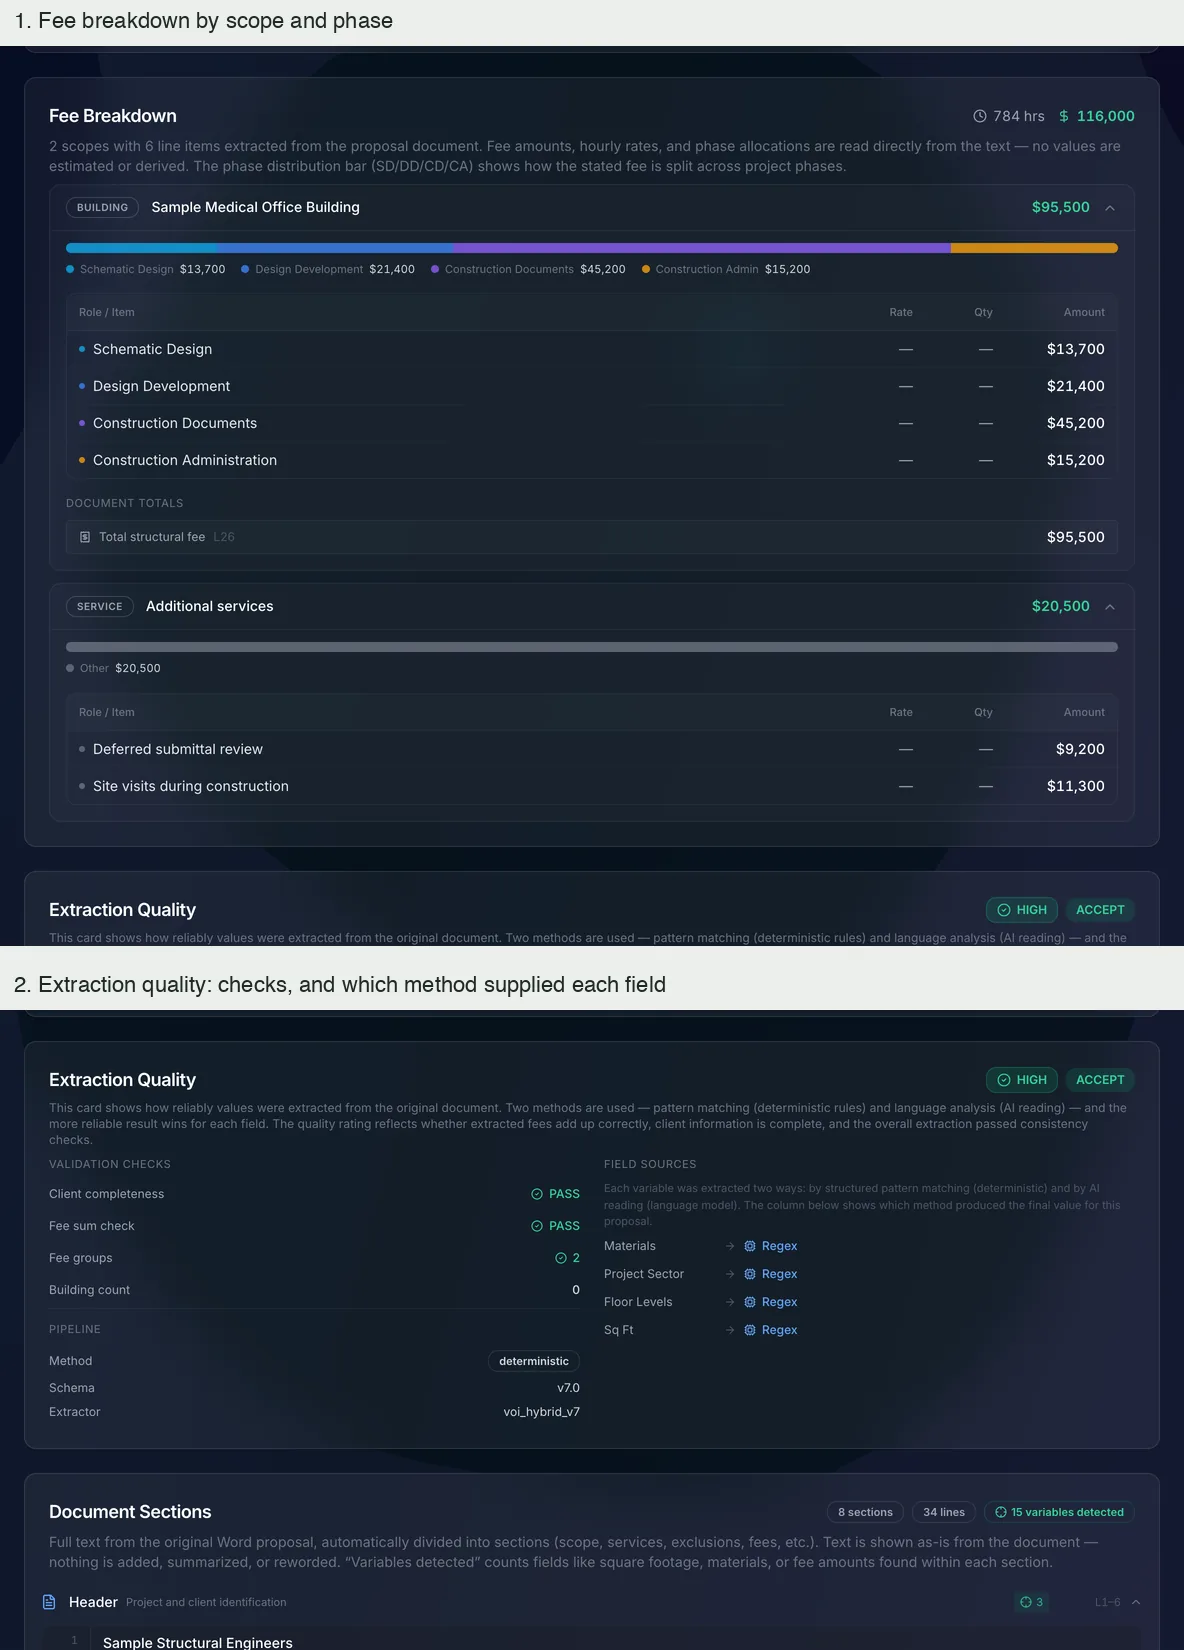
Fees by scope and phaseThe fee breakdown read from a proposal, and the quality card that says which method supplied each field. Local run, invented records.
A table of projects with status badges, then one project’s hours and phases
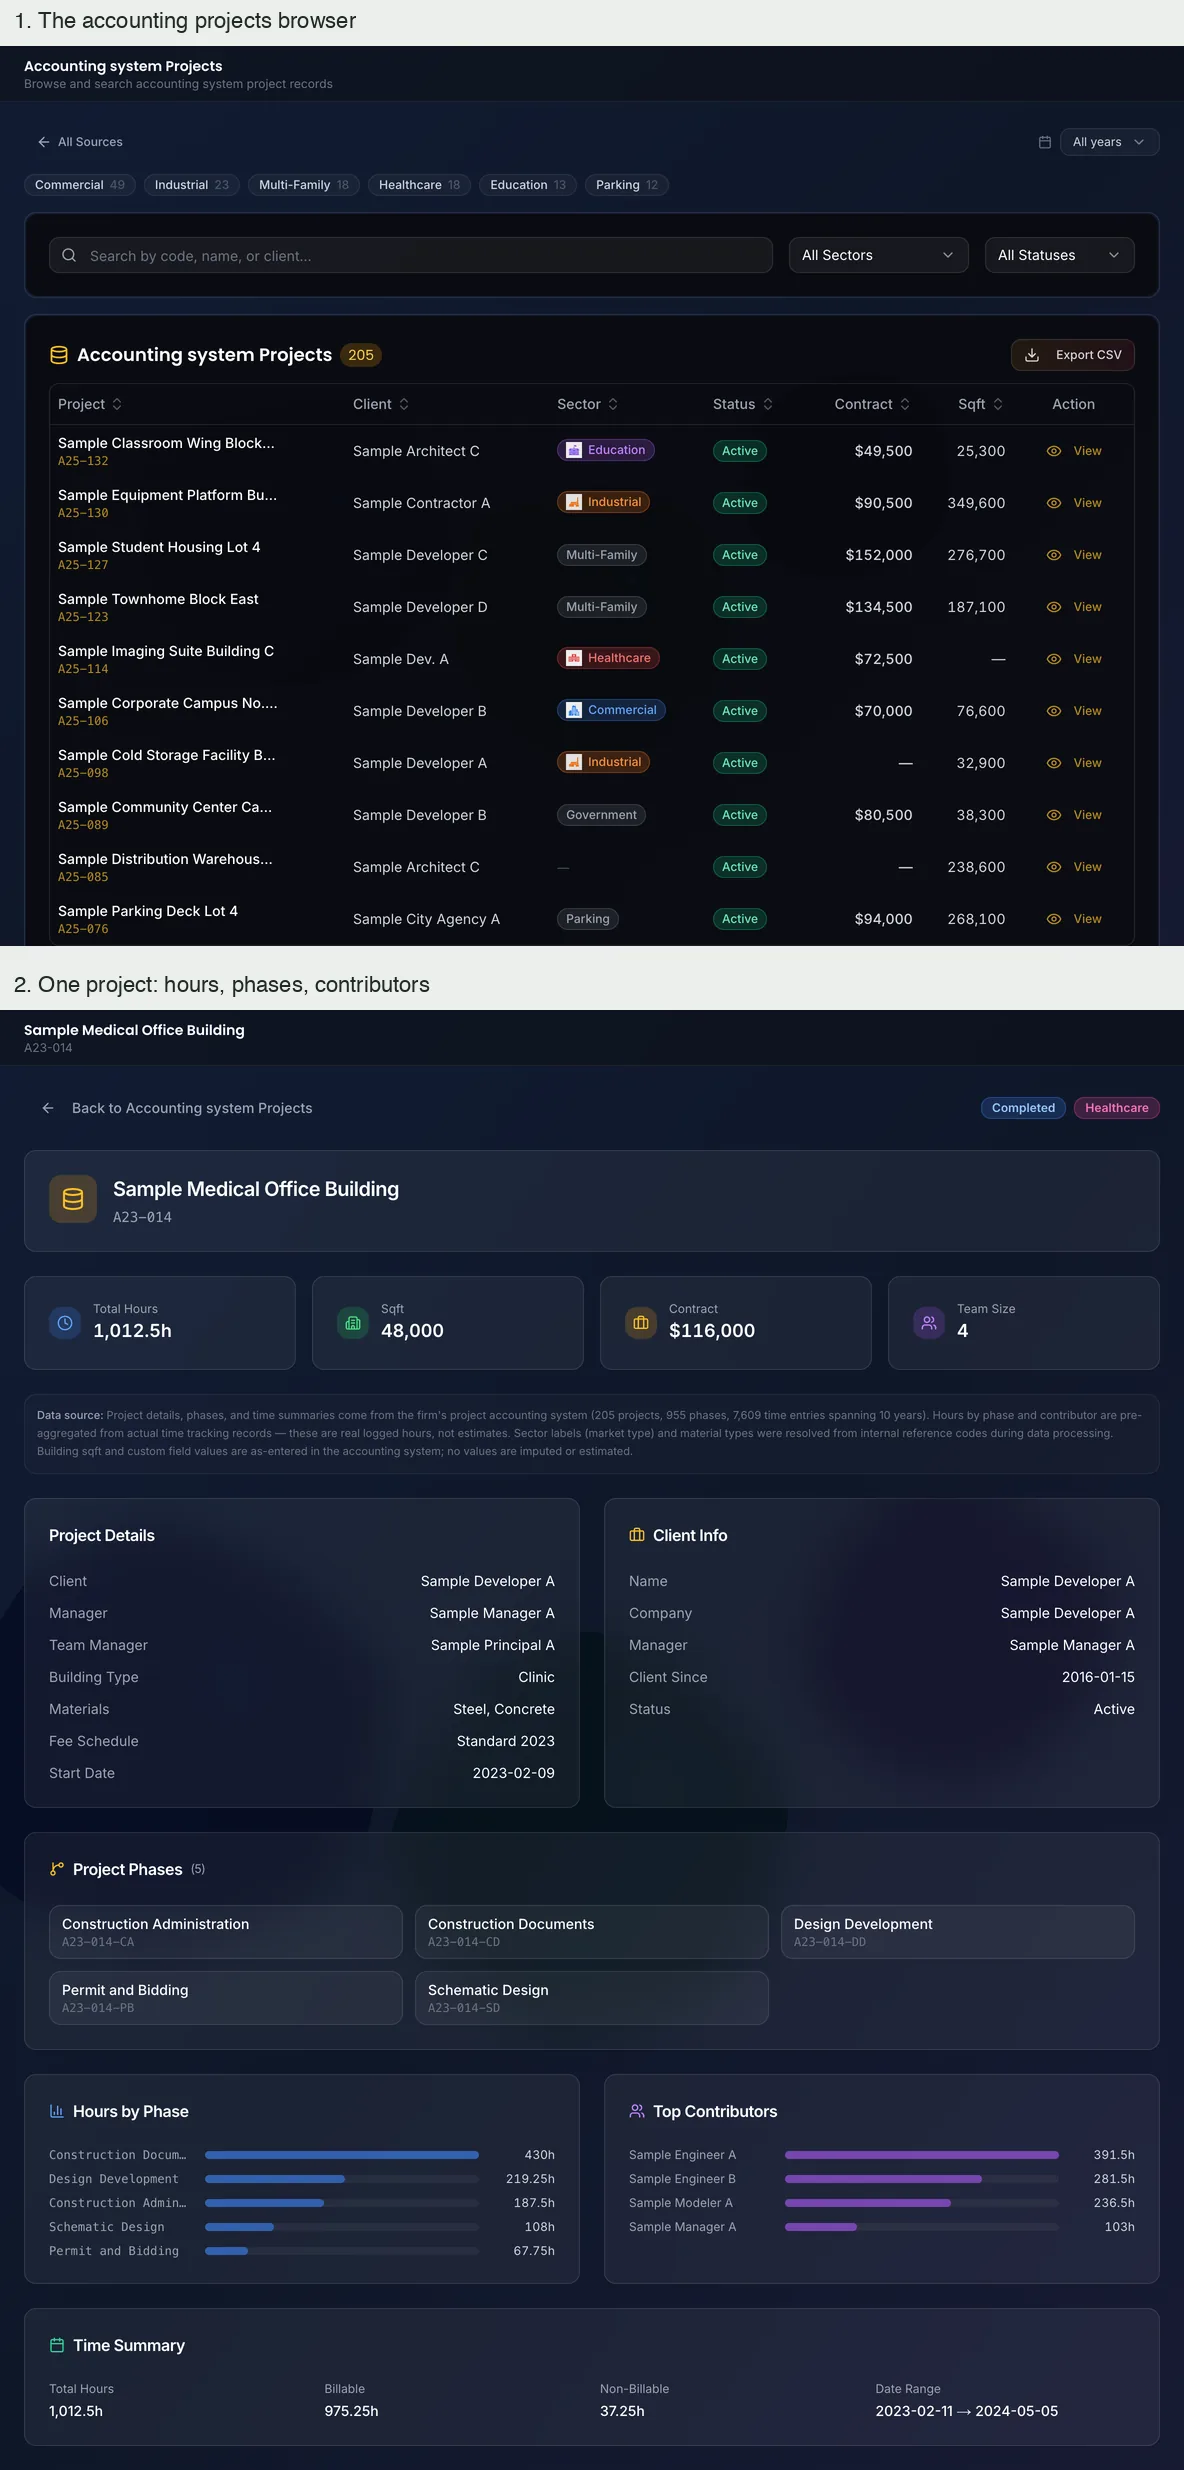
What was actually deliveredProject records from the accounting system: the list, and one project with its hours by phase and top contributors. Local run, invented records.
A table of workbooks, then one workbook’s page with sheet tabs and a project info section
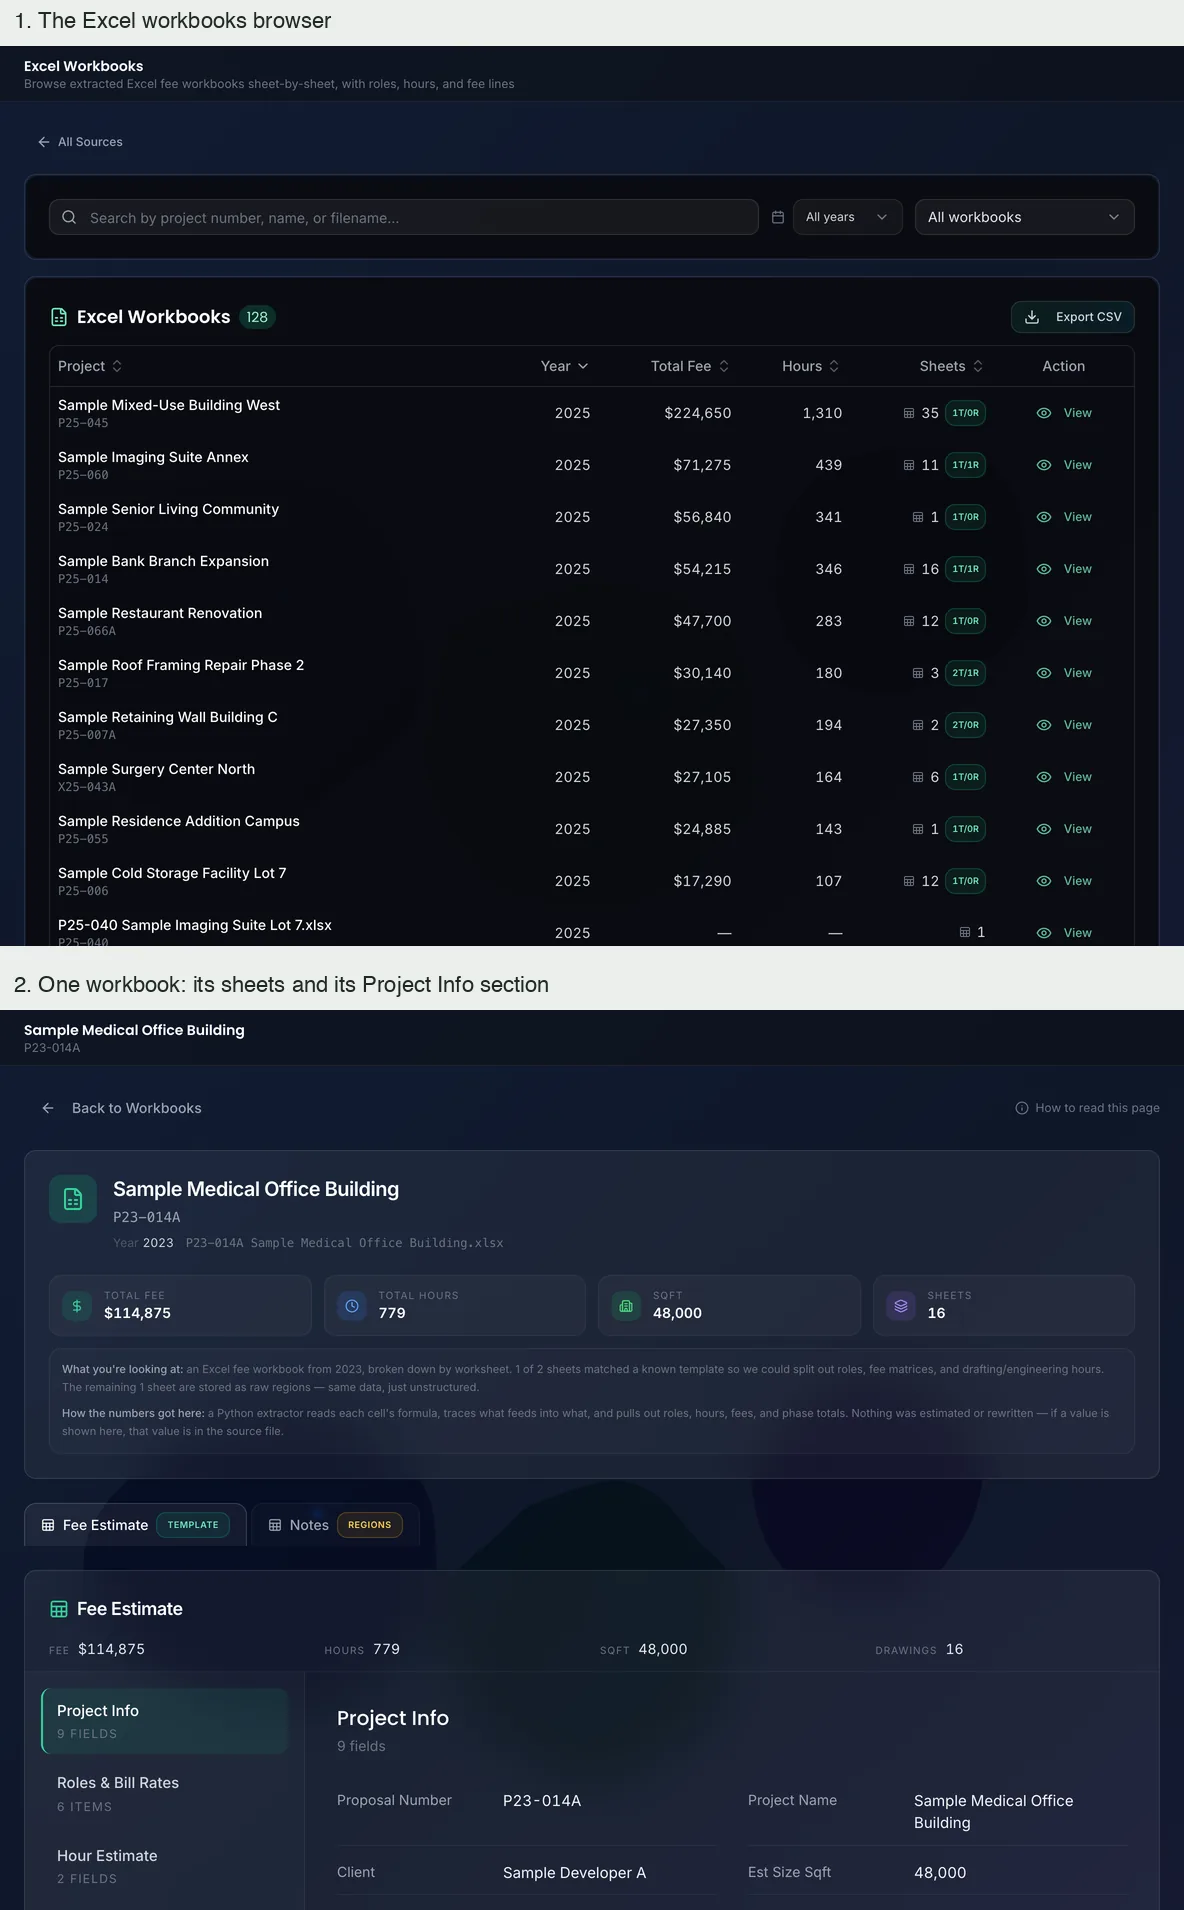
Fee workbooks, sheet by sheetExtracted Excel fee workbooks: the list, and one workbook with its sheets and sections. Local run, invented records.

Extraction

Spreadsheets become structured records without a model guessing.

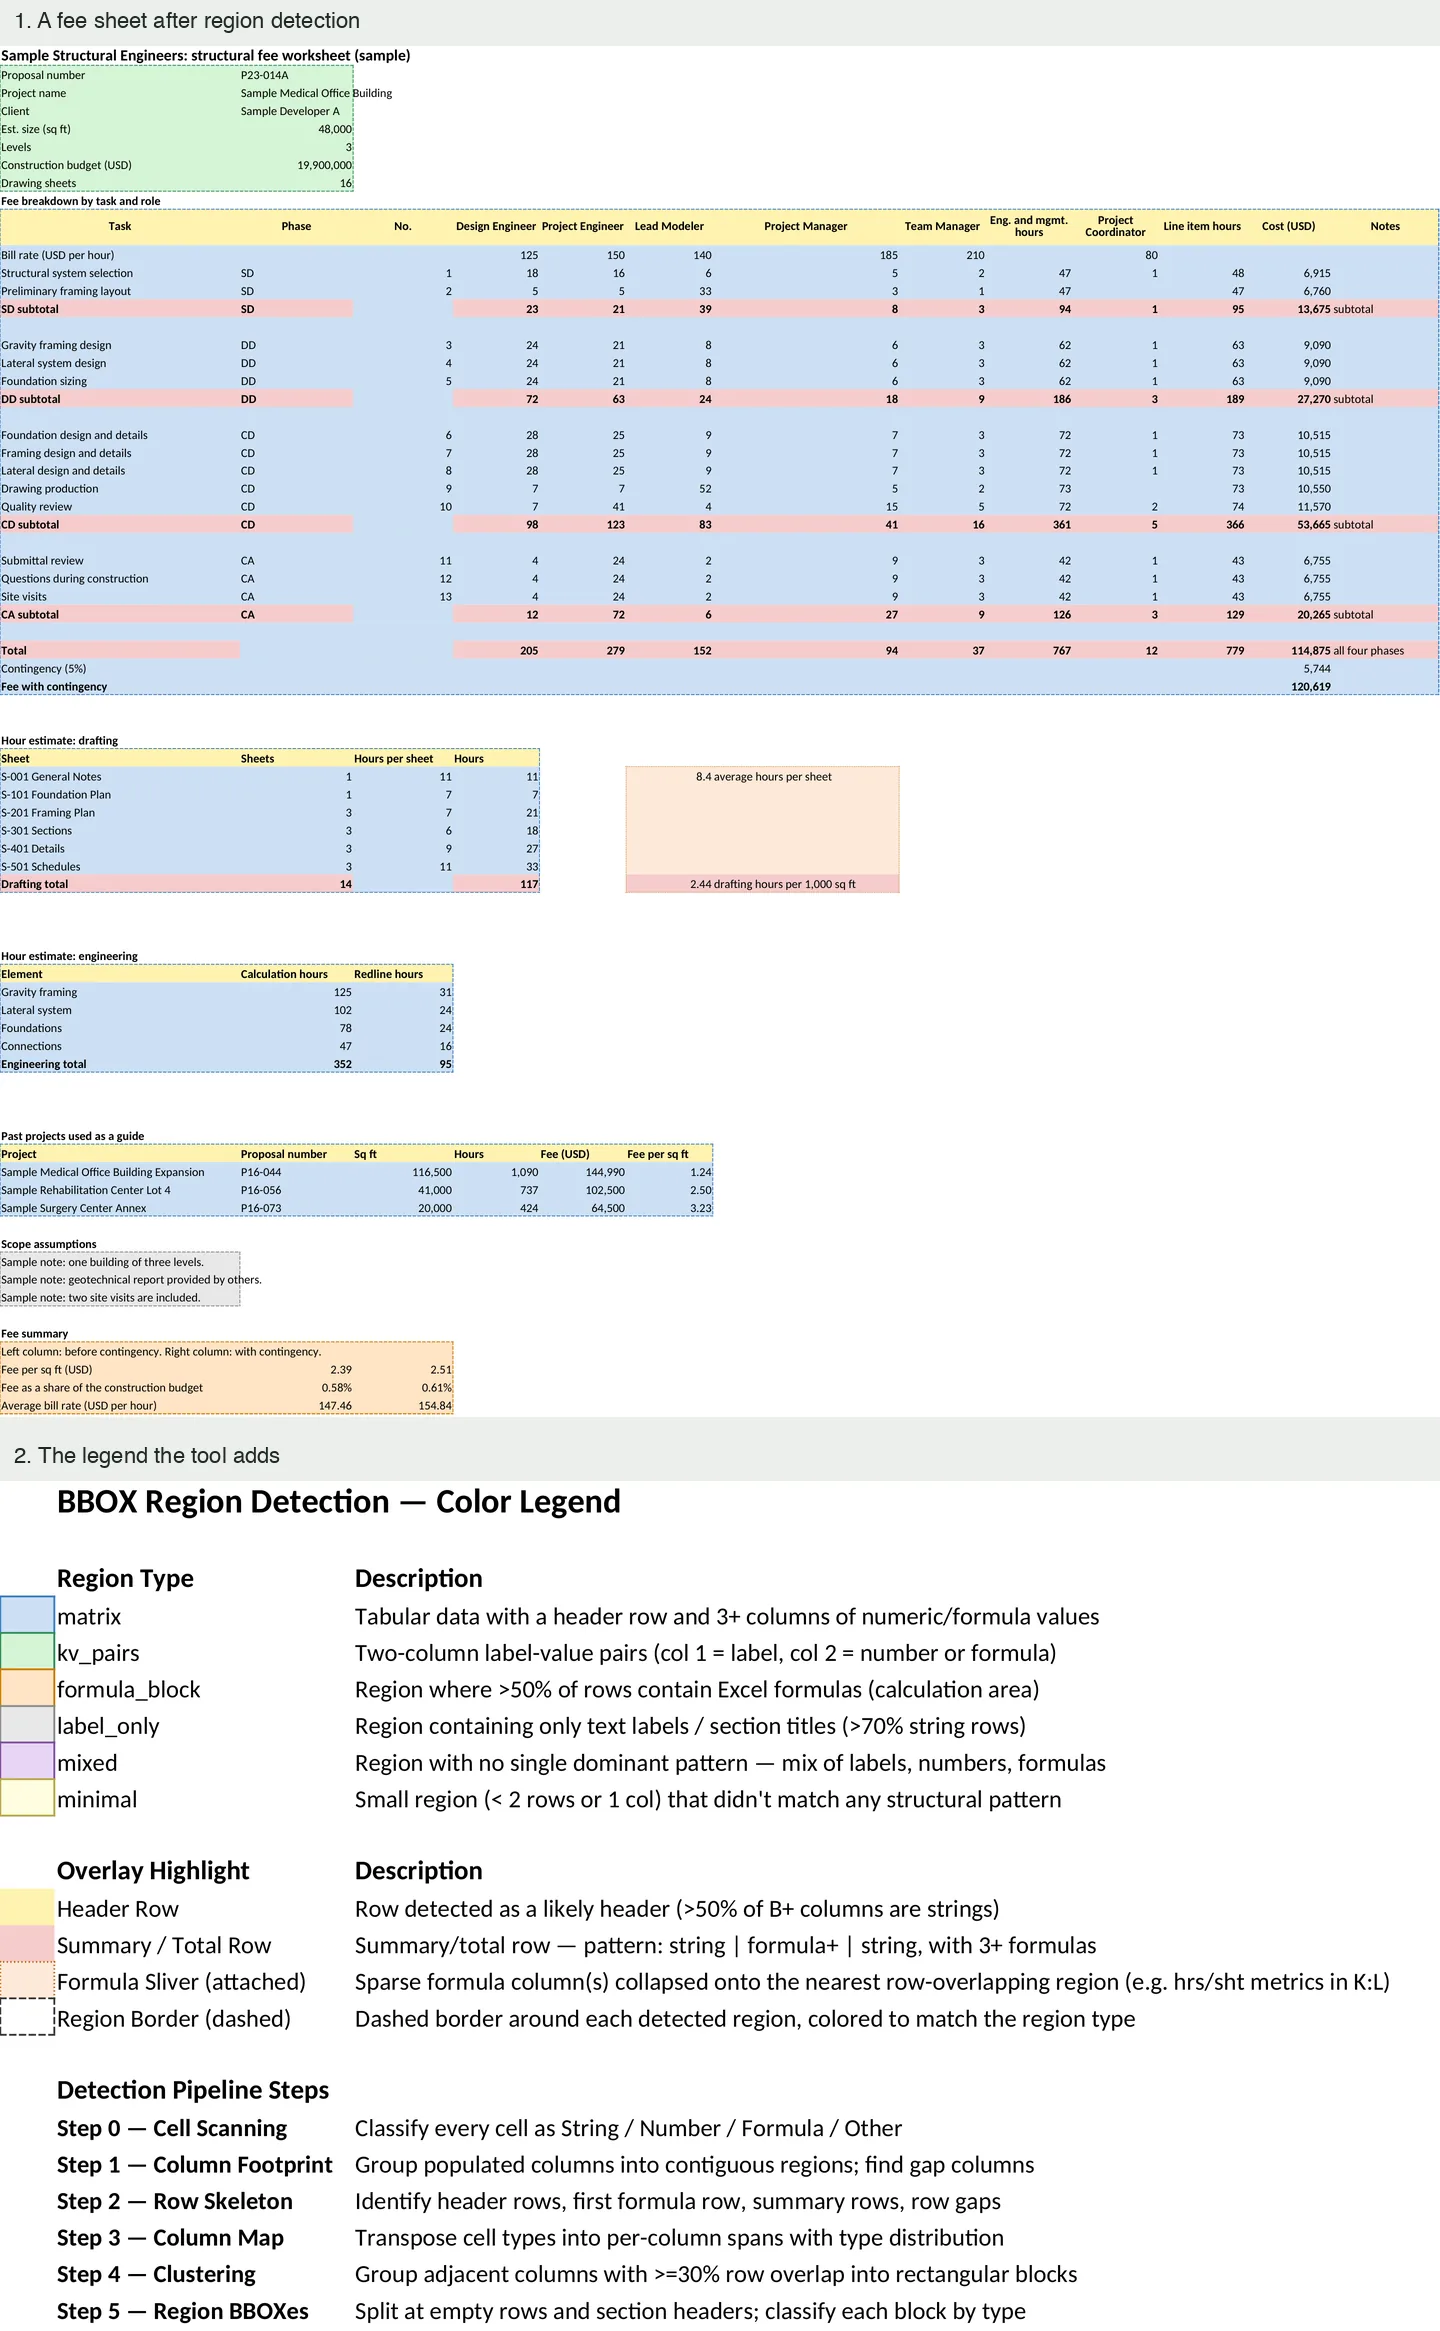
Fee workbooks are read by rule: a tool finds the regions of each sheet and types them, and sheets that match a known template become sections. A sheet that matches nothing is kept as raw regions, so nothing is invented to fill a gap.
A spreadsheet with coloured blocks marking tables, labels and formulas, above a colour legend
A workbook read as typed regionsA fee sheet after the region tool has coloured it: label-and-value pairs, tables, notes and formulas each become a typed region. A drawing of the annotated file, with the legend the tool adds. Local run, invented records.
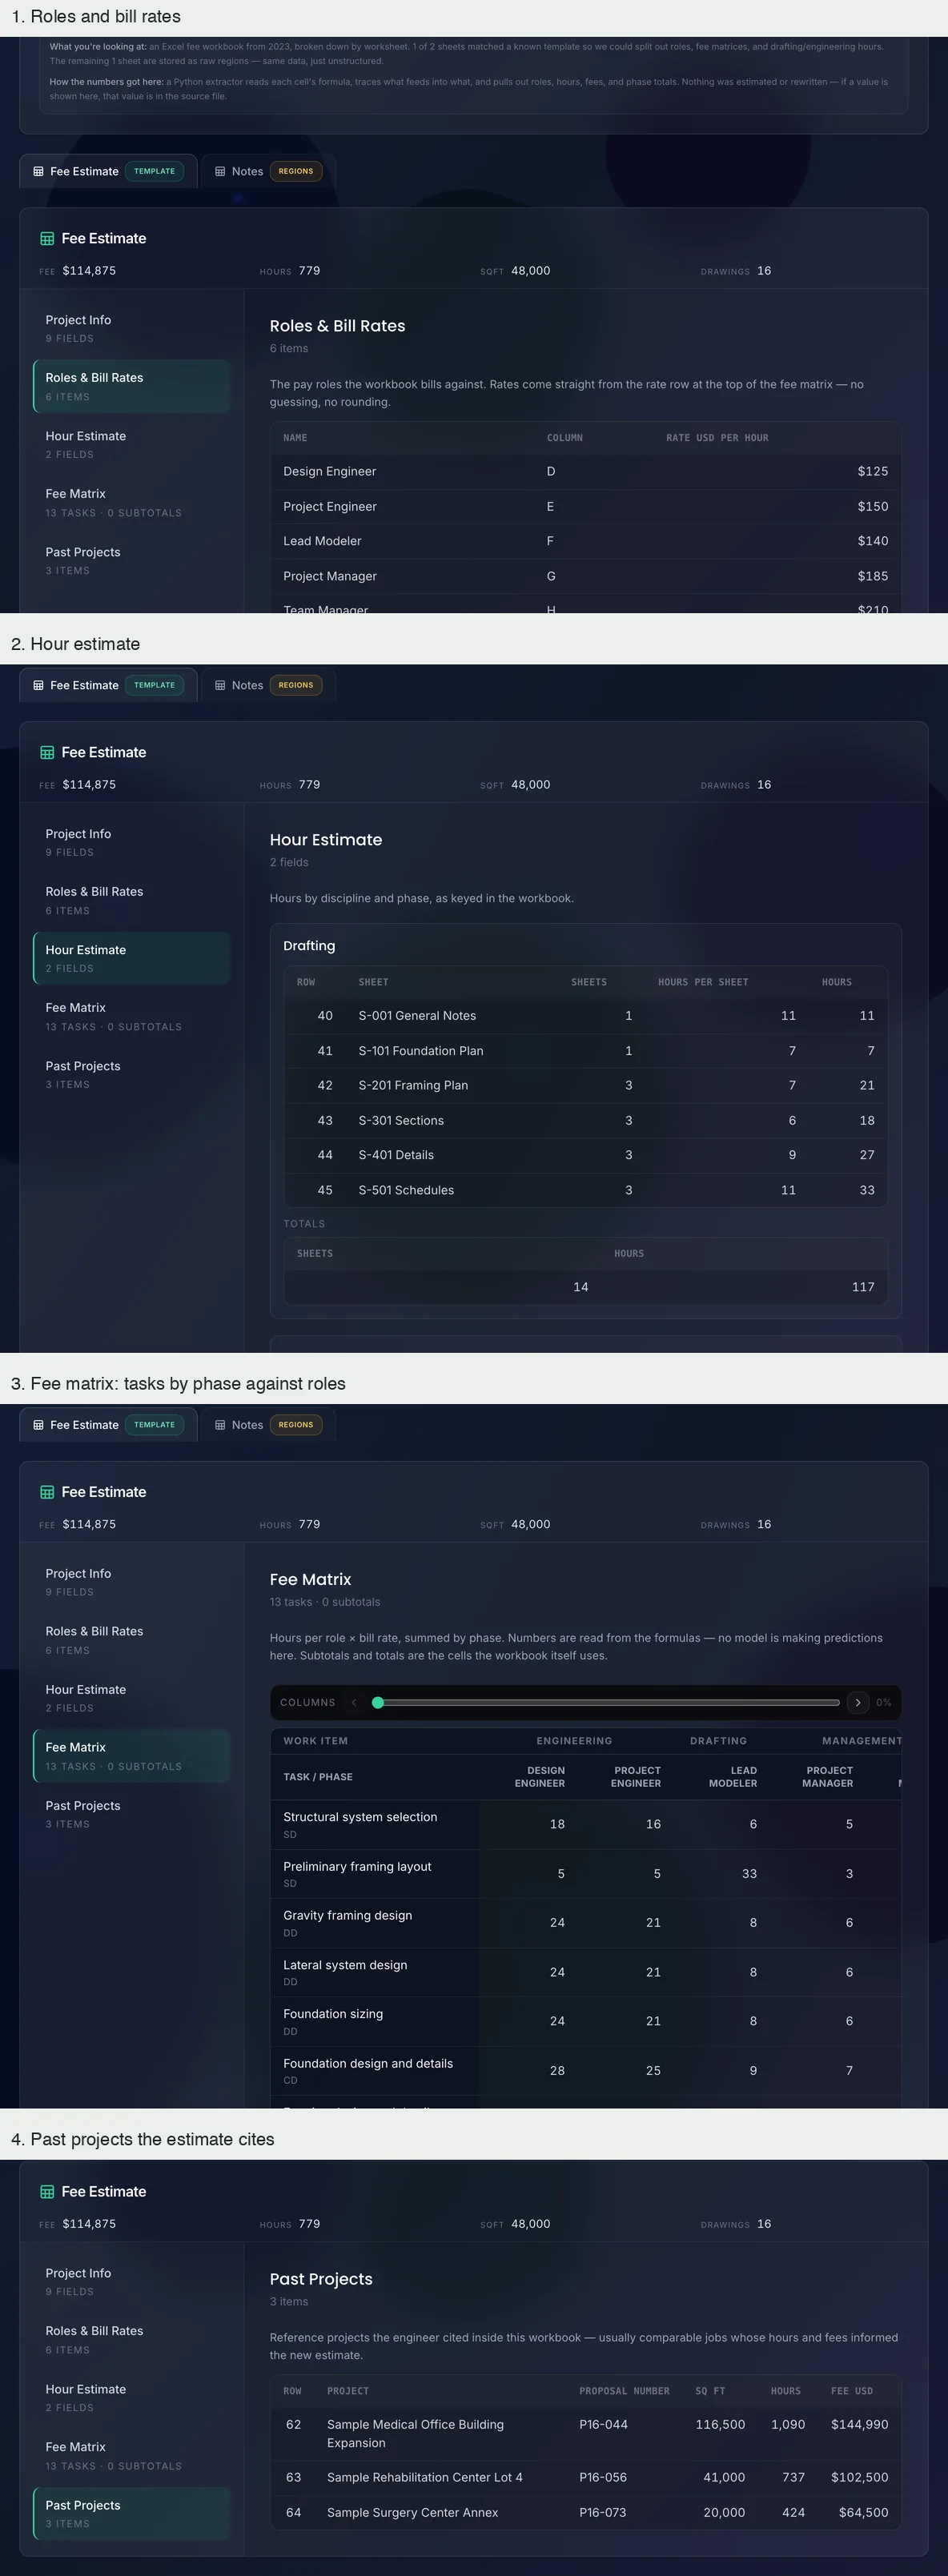
Four sections of a workbook page: bill rates, hour estimate, fee matrix and past projects
From regions to sectionsWhat the extractor finds in one workbook: roles and bill rates, the hour estimate, the fee matrix and the past projects the estimate cites. Local run, invented records.

Across the history

The same records, in aggregate and side by side.

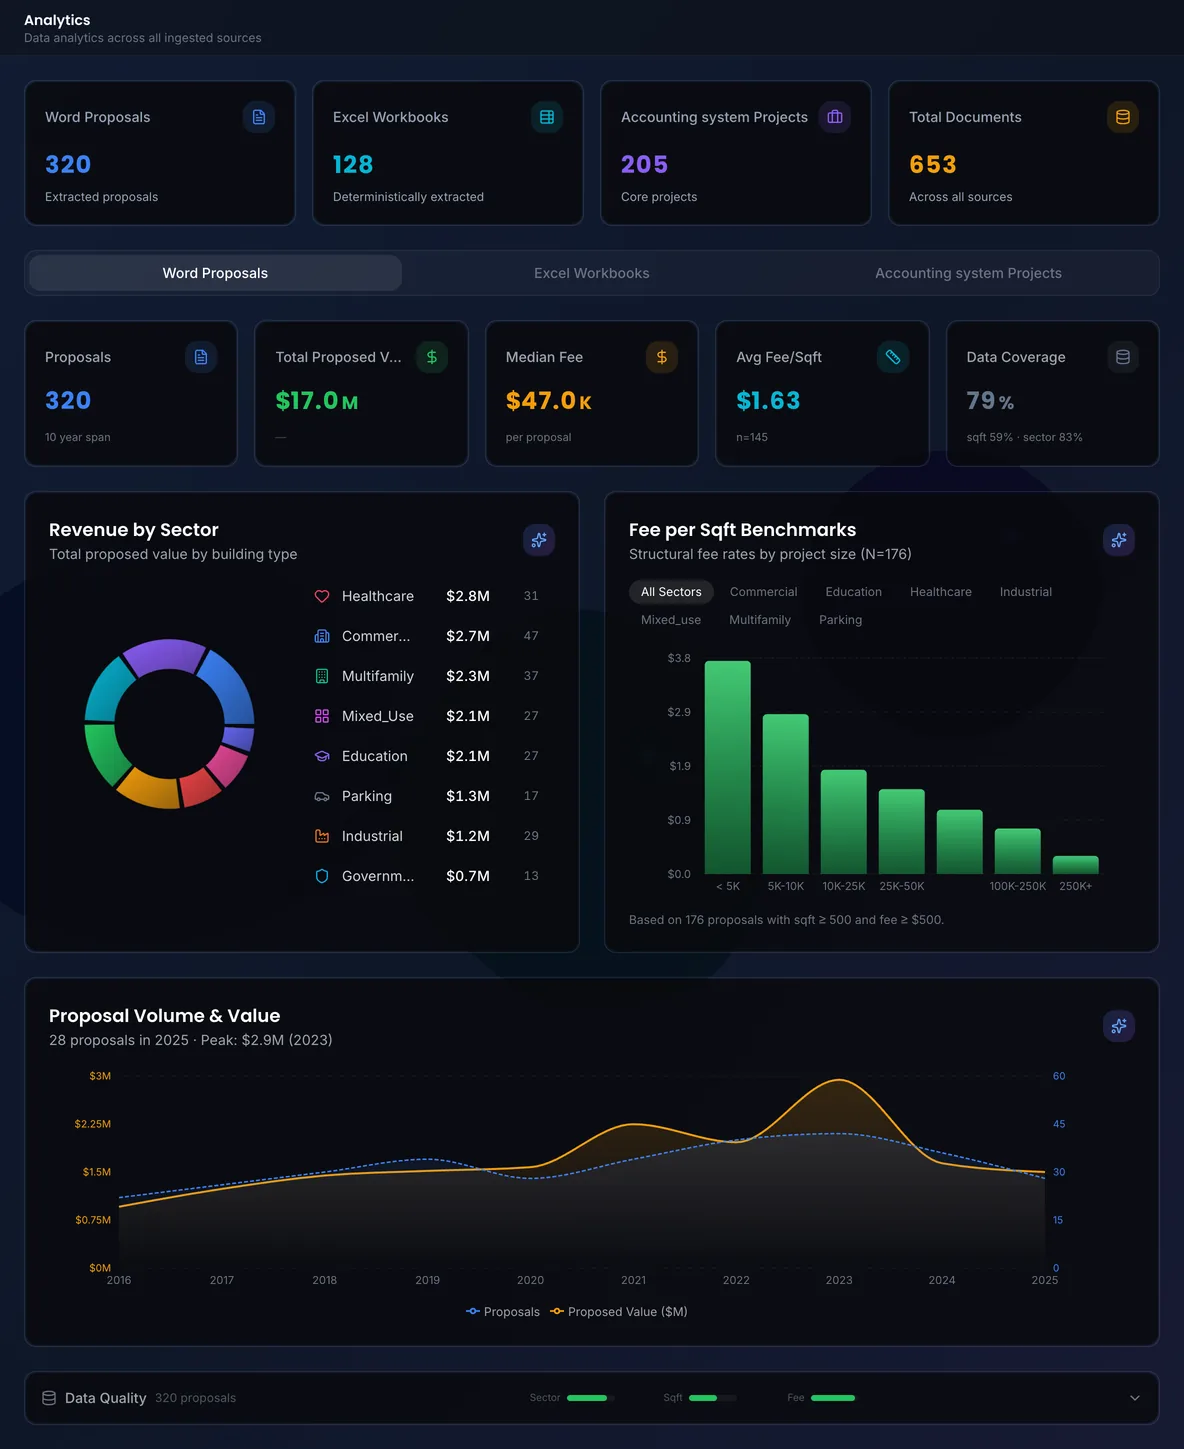
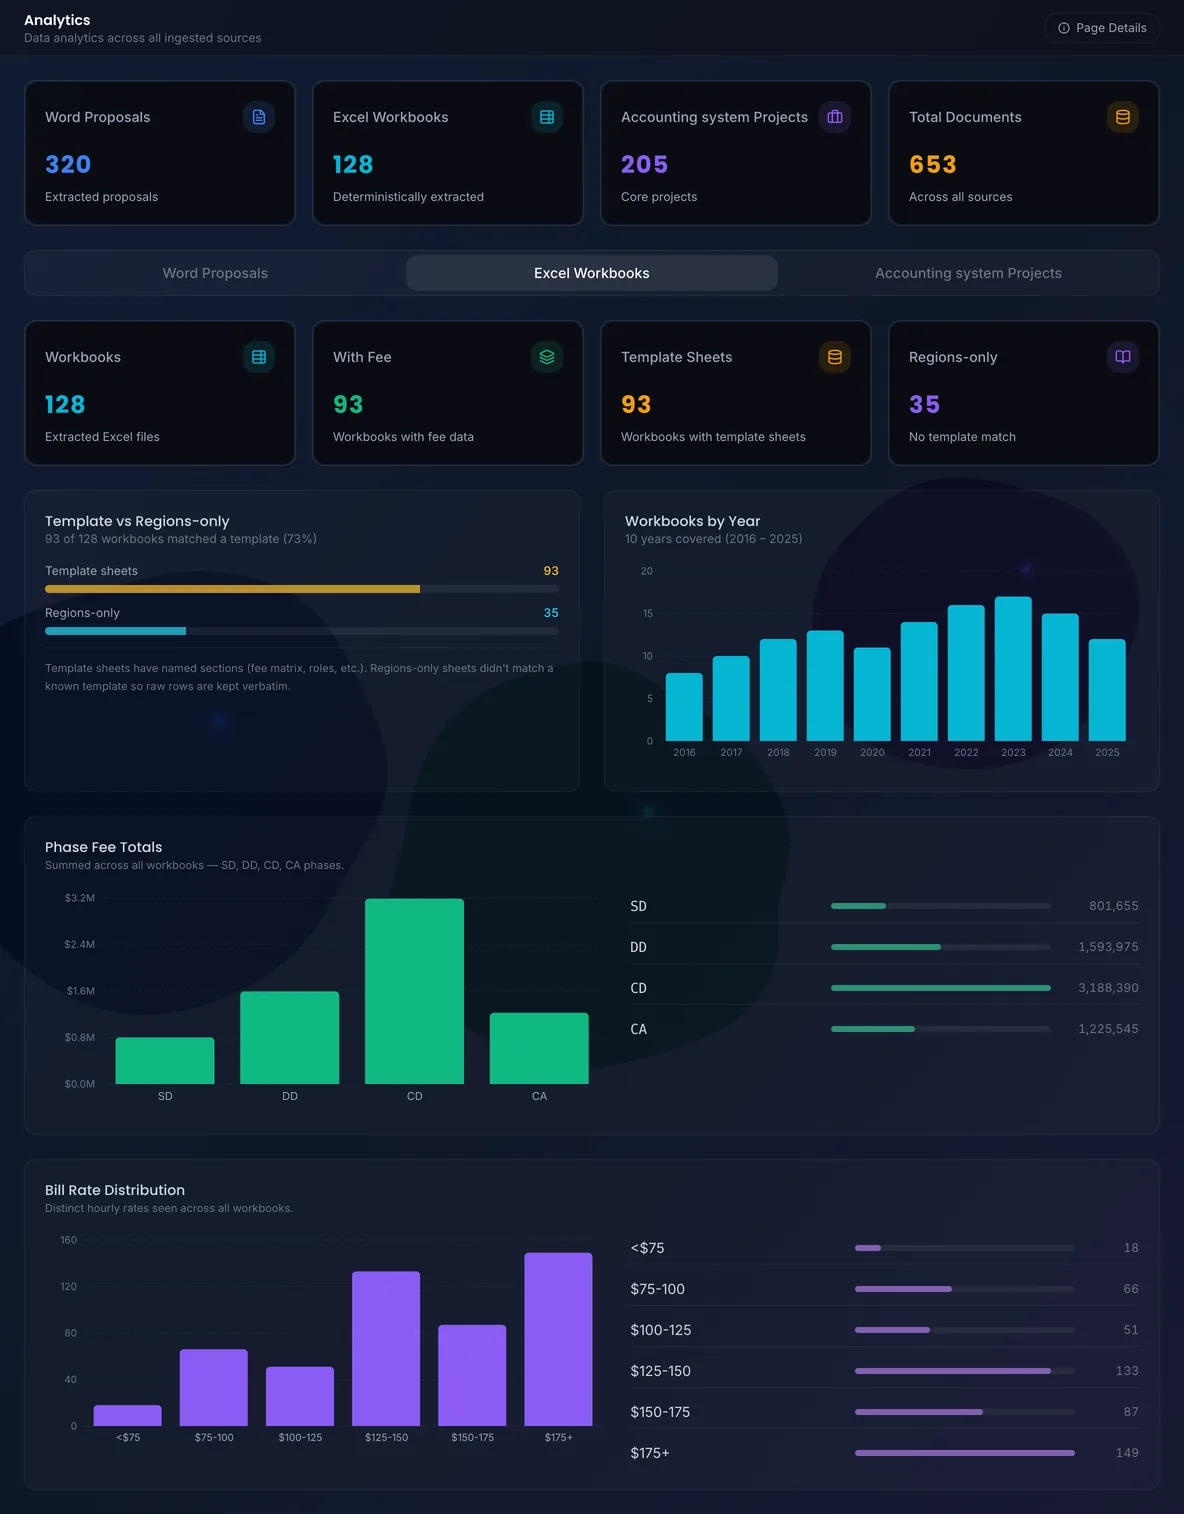
Charts over each source, and a page that sets up to three proposals beside each other. Every figure is the invented dataset’s.
An analytics page with headline figures, a donut chart, a bar chart and an area chart
Proposals, in aggregateValue by sector, fee per square foot by size band, and proposal volume and value by year. Local run, invented records.
An analytics page with workbook counts and three bar charts
Workbooks, in aggregateHow many workbooks matched a template, workbooks by year, fee totals by phase and the spread of bill rates. Local run, invented records.
A comparison table of three proposals with coloured differences
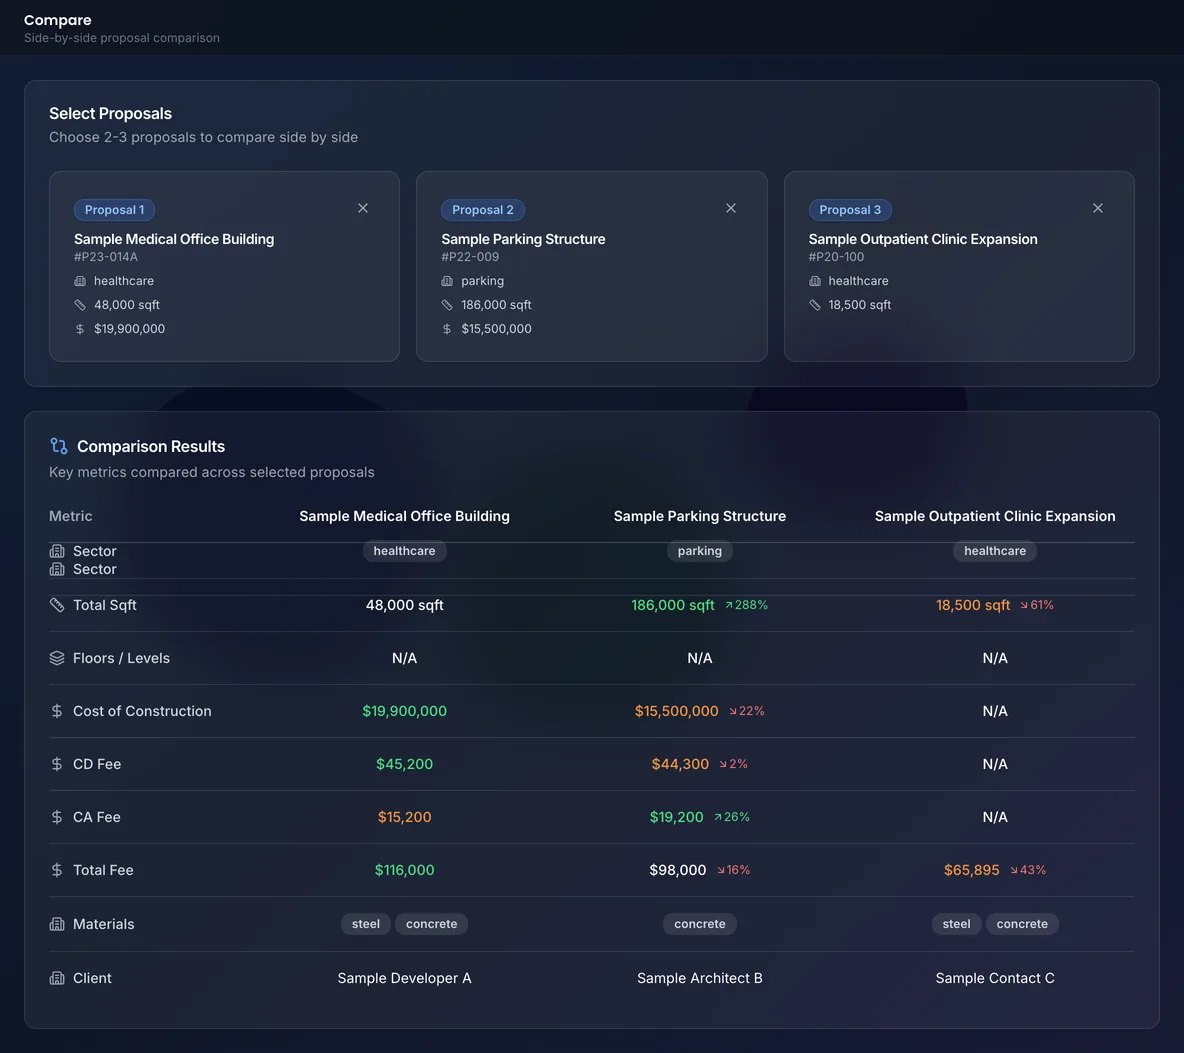
Three proposals side by sideArea, cost, fees, materials and client for three proposals, with the difference from the first in colour. Local run, invented records.

Exploratory

From a new project to a fee, one step at a time.

Exploratory · estimates not yet validated

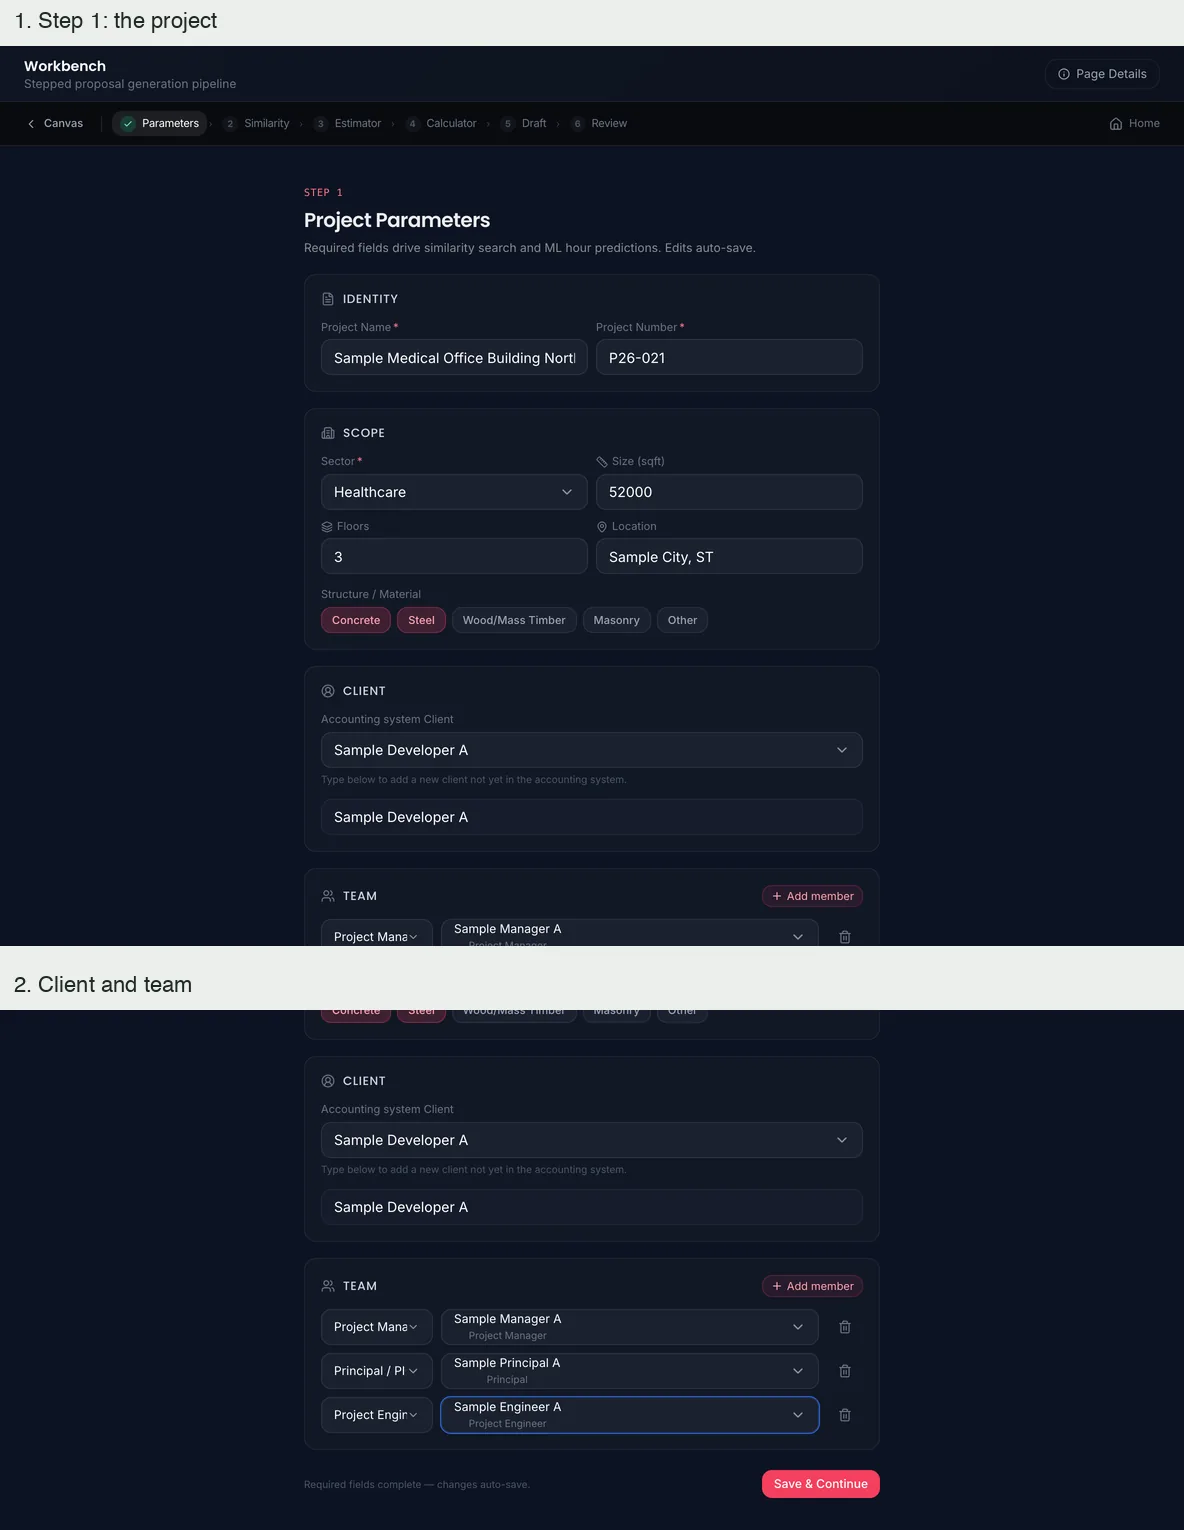
The workbench walks a new project through six steps: describe it, find similar past work, estimate hours, work out the fee, draft, review. It is exploratory until the source records are reconciled. Two of its steps call a model; no model was called for these pictures, so those steps are shown as their form and waiting state.
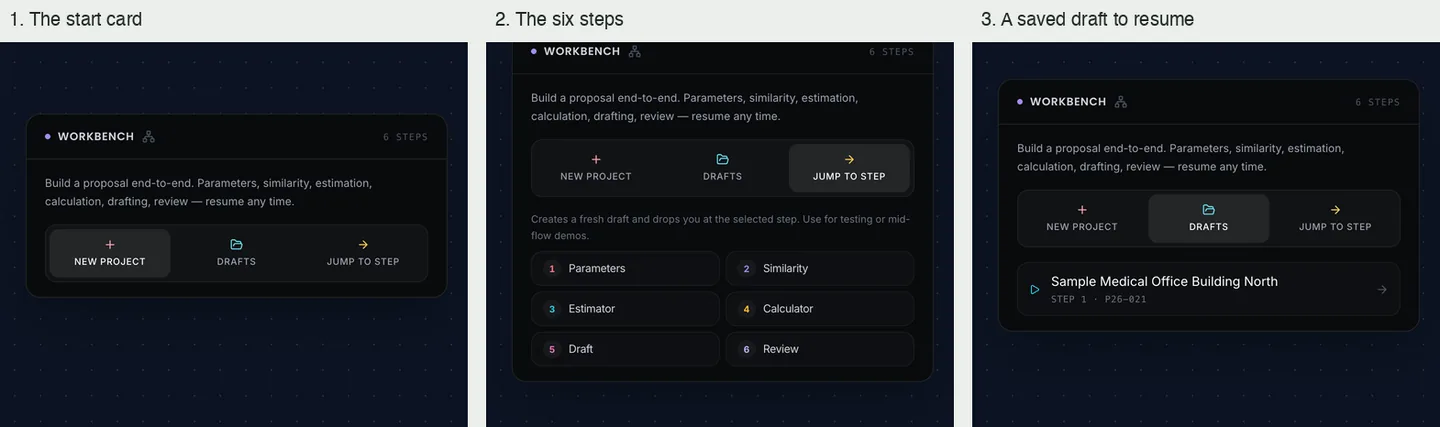
Three views of a small start card: new project, the six steps, and a saved draft
Six steps, with drafts to resumeThe workbench opens on a start card: a new project, a saved draft, or one of six steps. Local run, invented records.
A project parameters form filled in, then the client and team section
Describe the projectStep 1: identity, scope, client and team for an invented project. Local run, invented records.
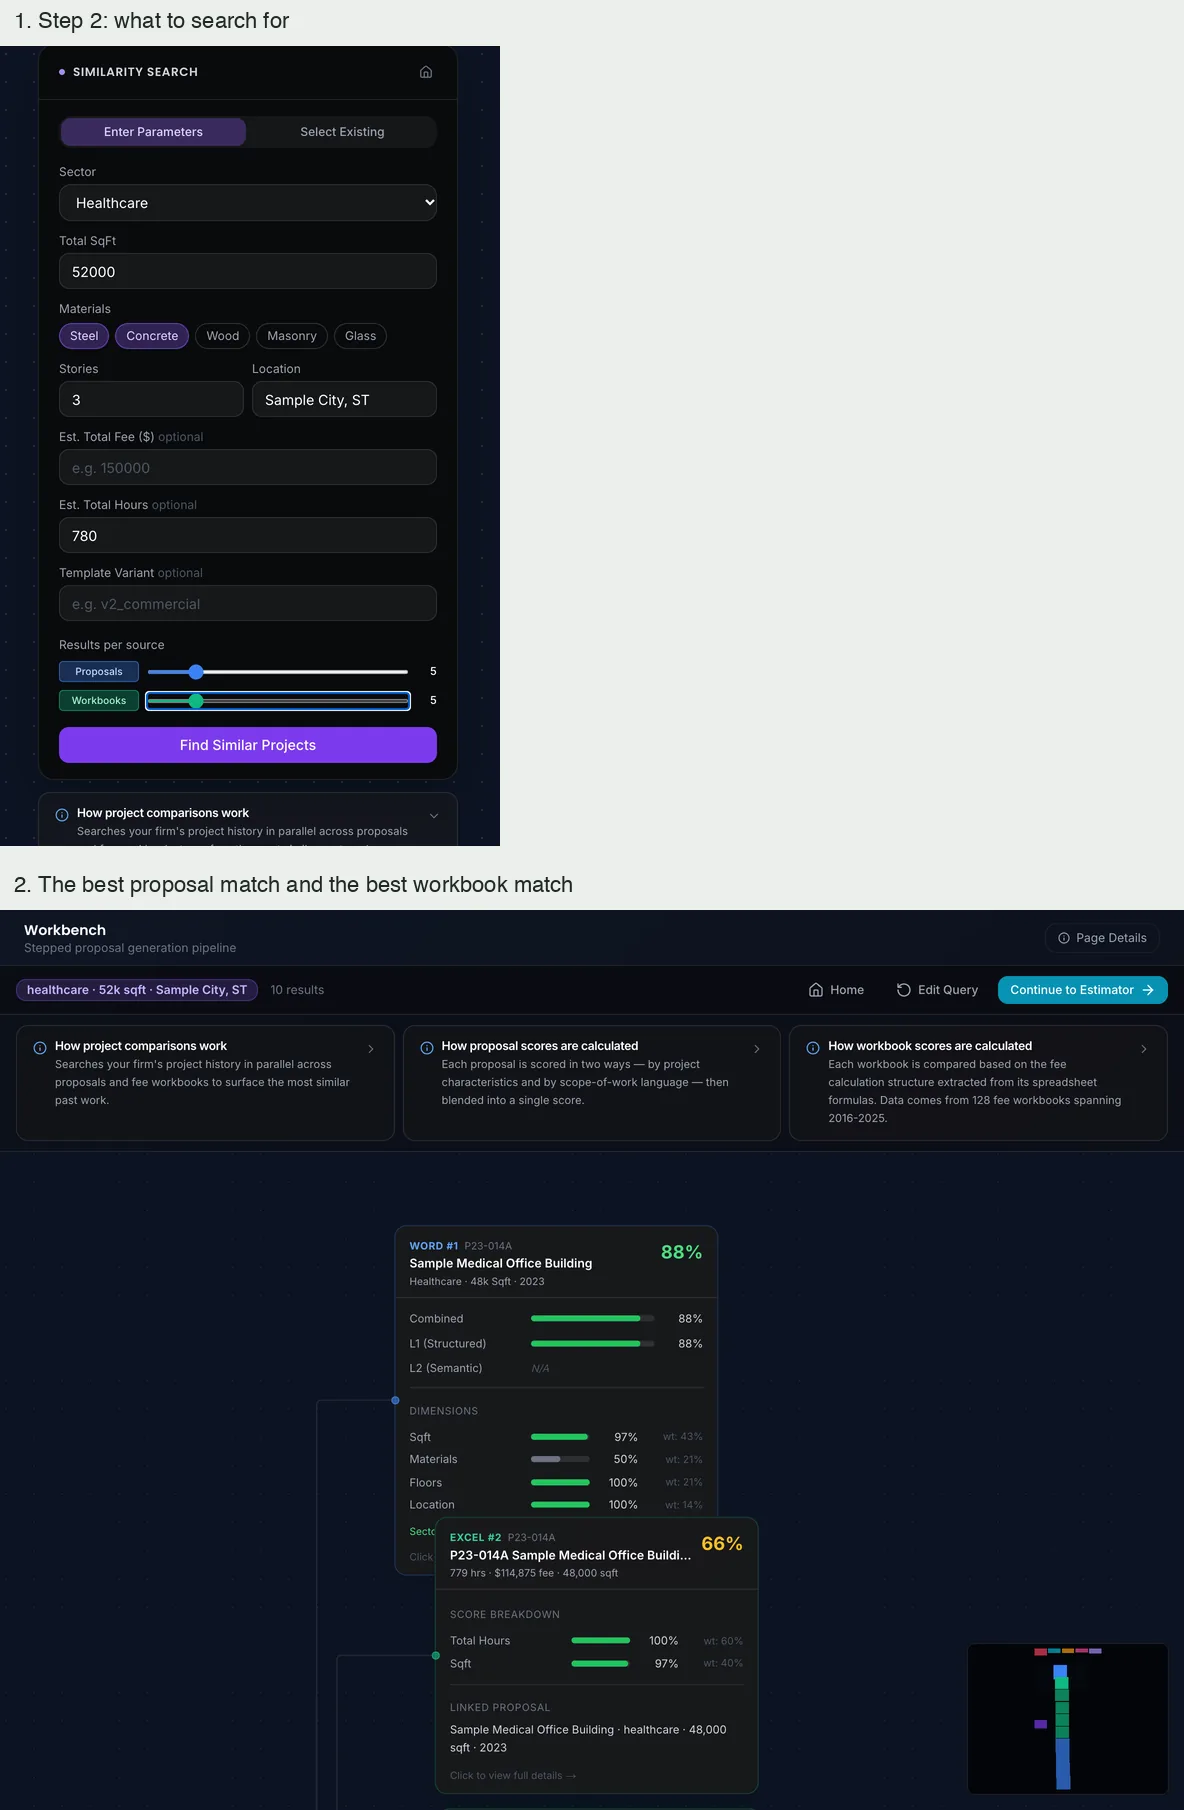
A similarity search form, then two result cards with score bars on a canvas
Find similar past workStep 2: the search, and the best proposal match and the best workbook match with their score bars. The ranking is the product’s own scoring code; no model is involved. Local run, invented records.
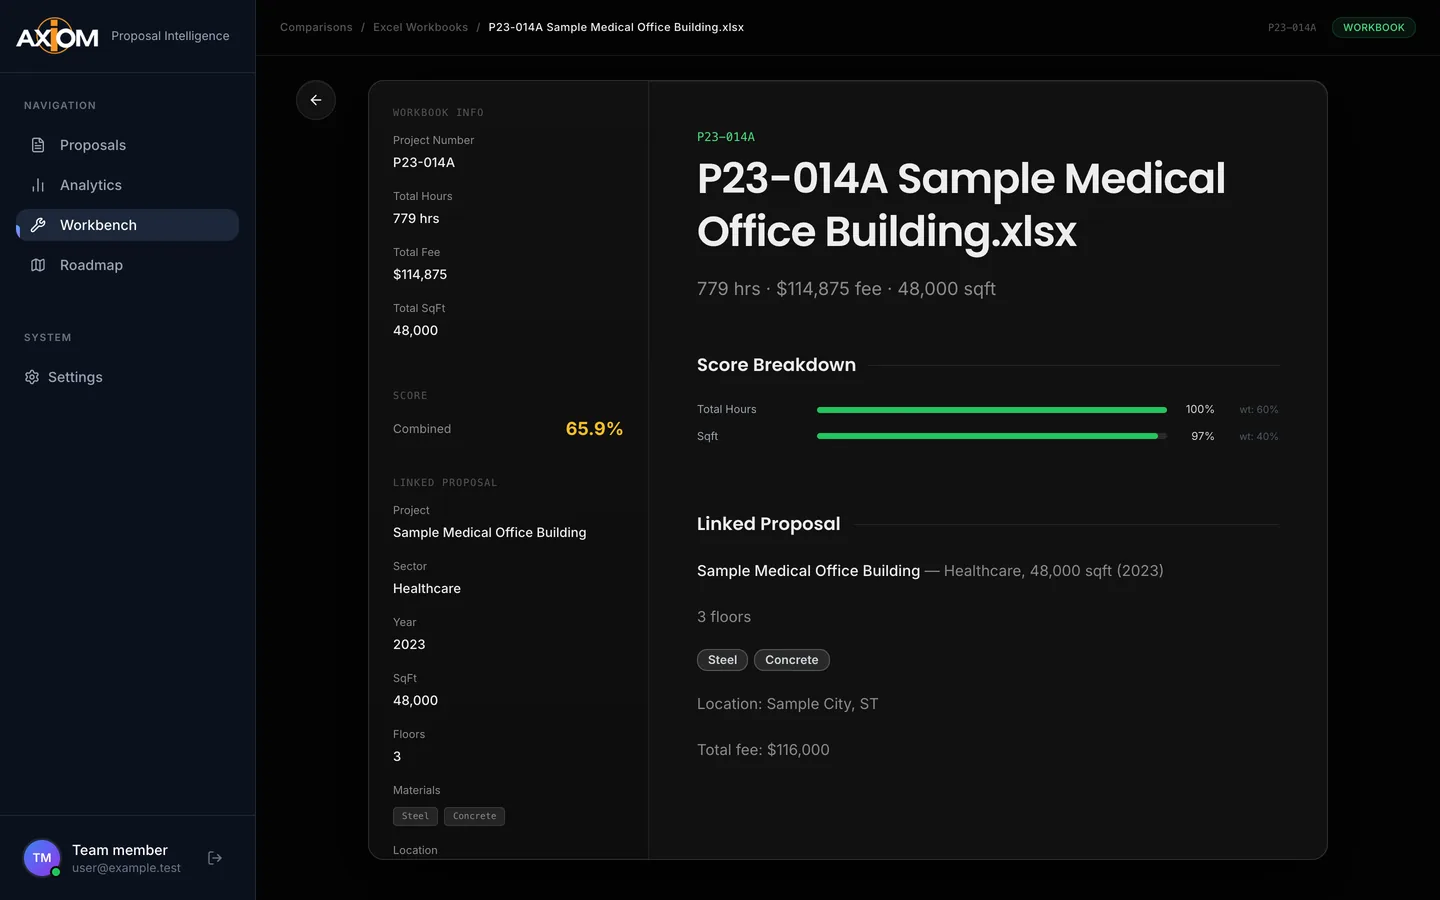
A result page for a workbook with a score breakdown and a linked proposal
Why a result matchedA workbook result opened: its hours, fee and area, the score breakdown and the proposal it is linked to. Local run, invented records.
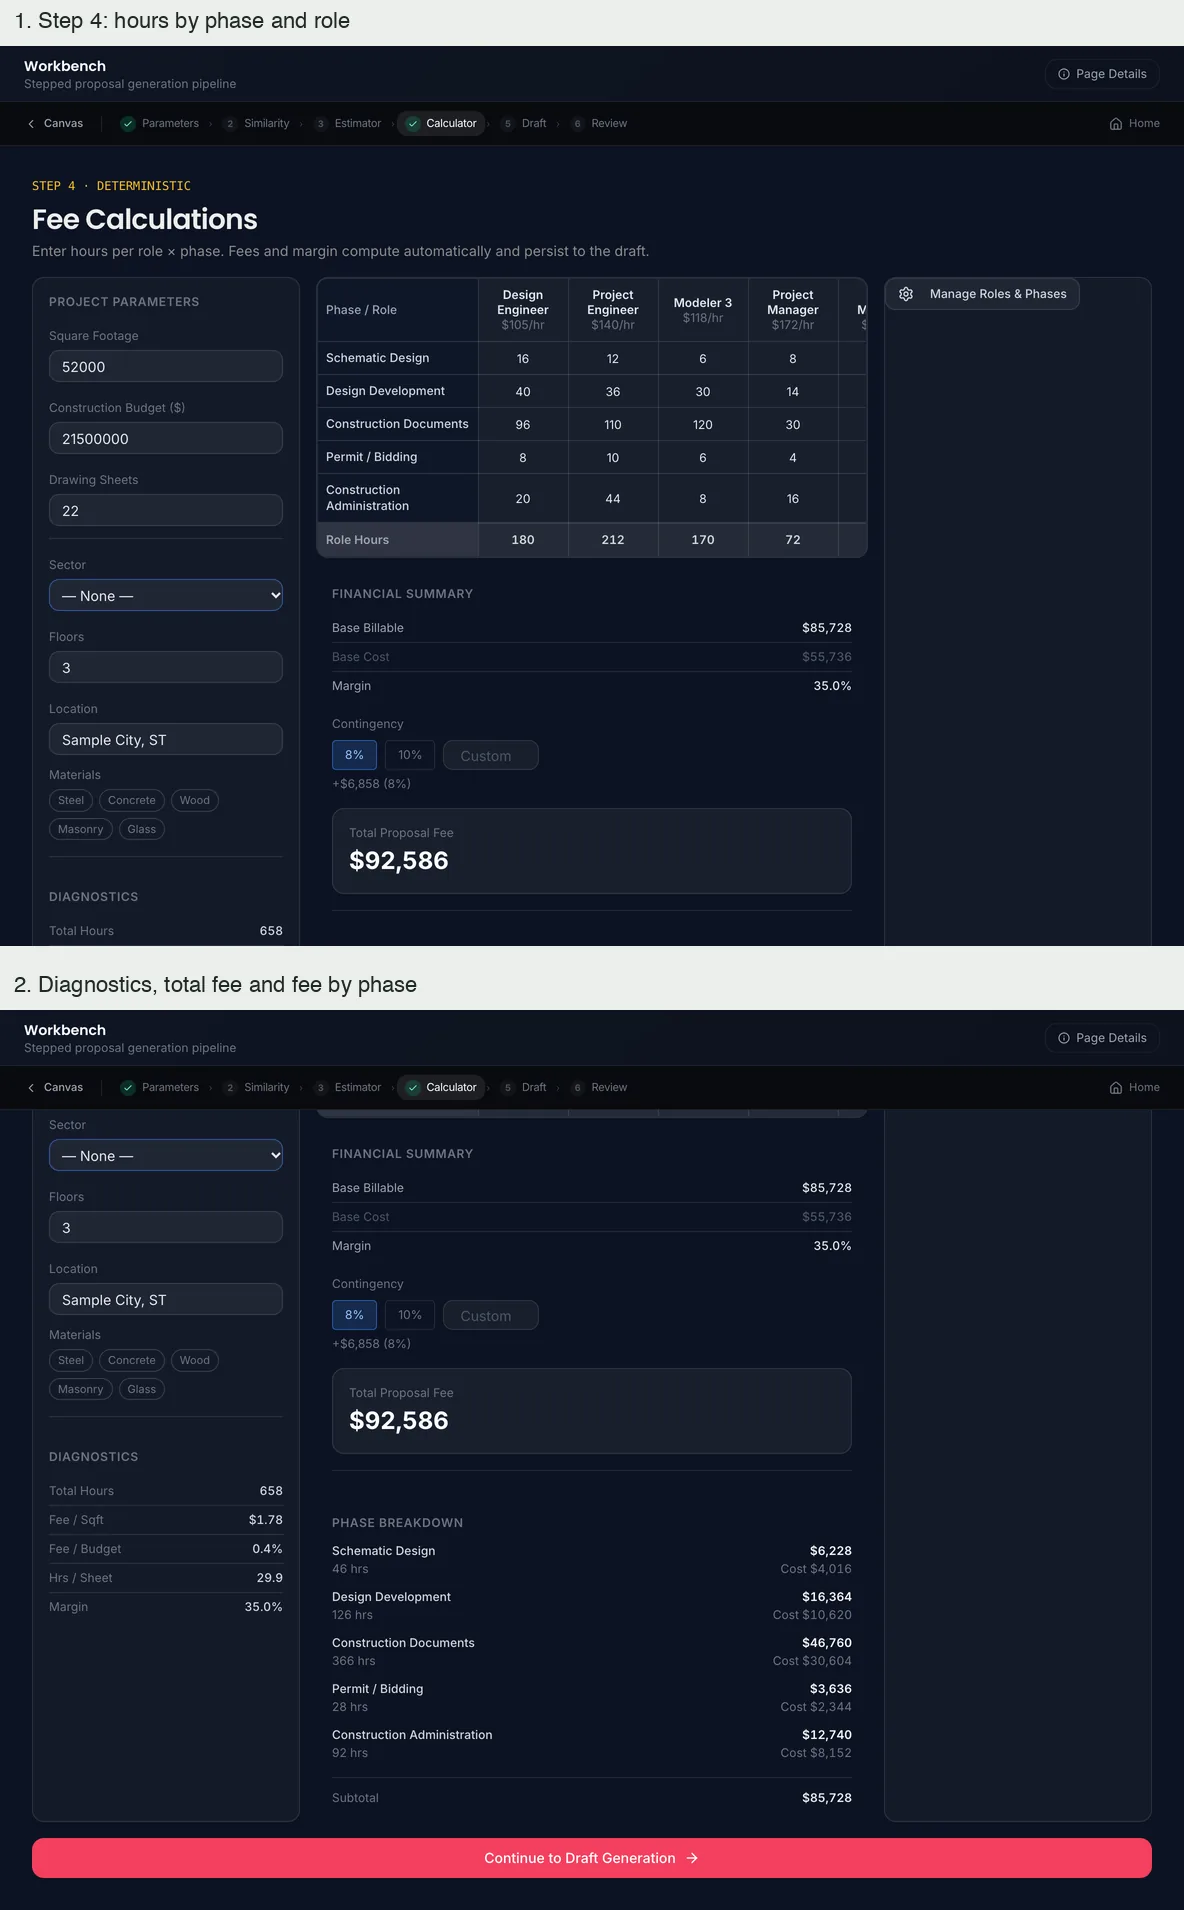
A fee calculation grid of phases against roles, then a financial summary
Work out the feeStep 4: hours by phase and role give the billable base, cost, margin and total fee, with diagnostics and the fee by phase. Local run, invented records.
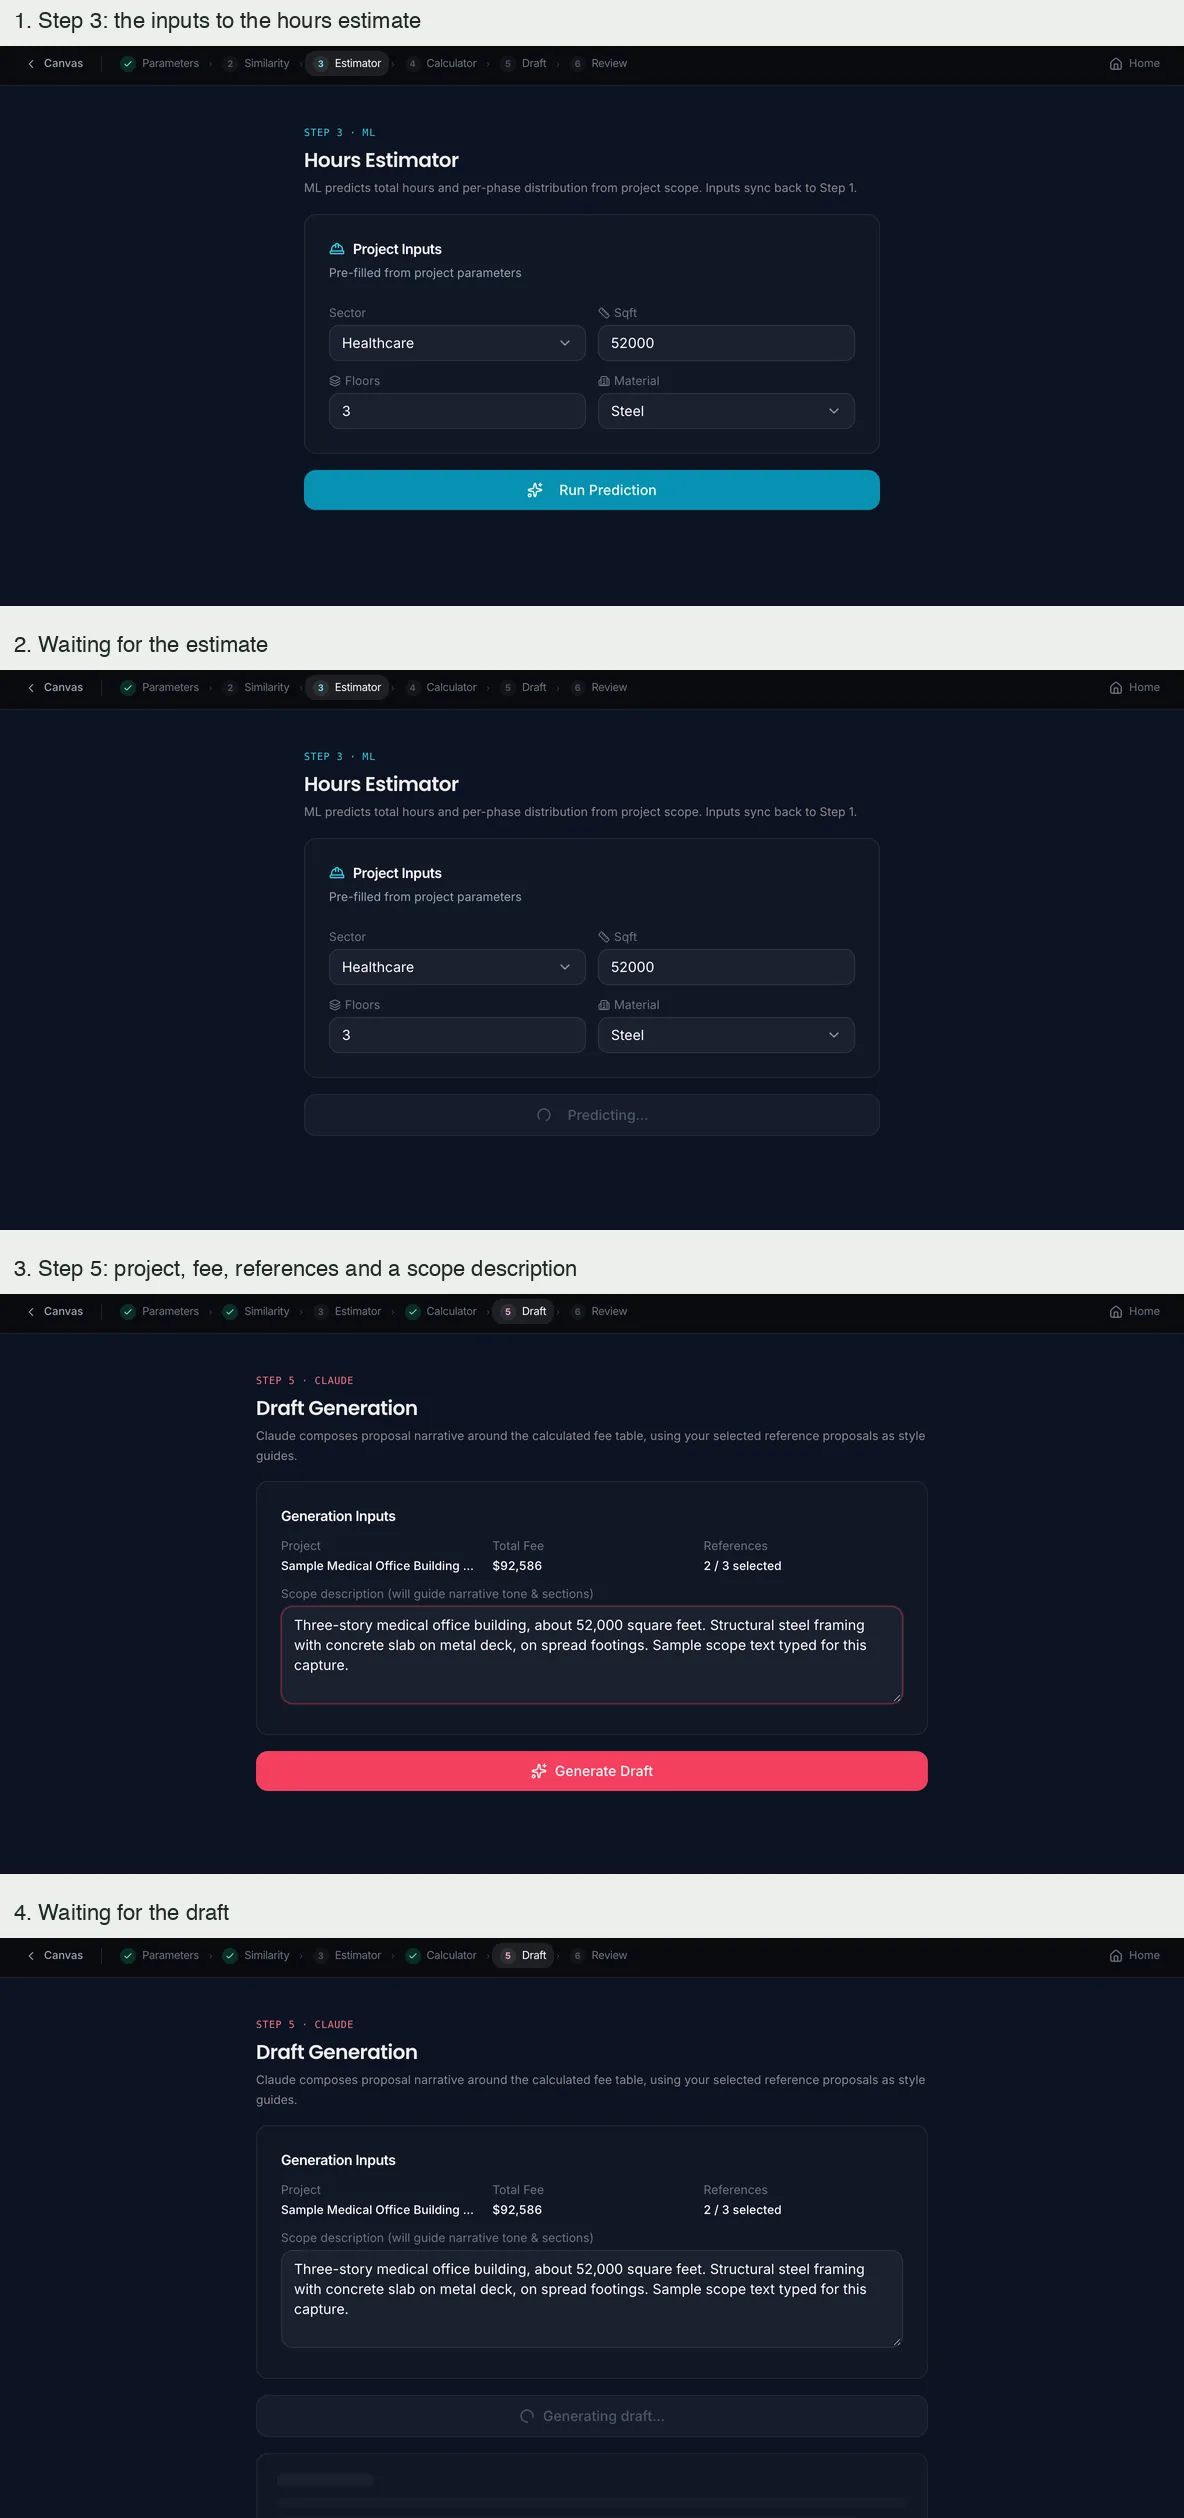
Four views: an estimator form, a waiting state, a draft form and a waiting state
The two steps that call a modelThe hours estimator and the draft generator, each as its form and its waiting state. Their results are a model’s output and are not shown: no model was called for these pictures. Local run, invented records.

A separate prototype · not launched

A morning briefing assembled by a browser assistant.

Prototype · paused before launch

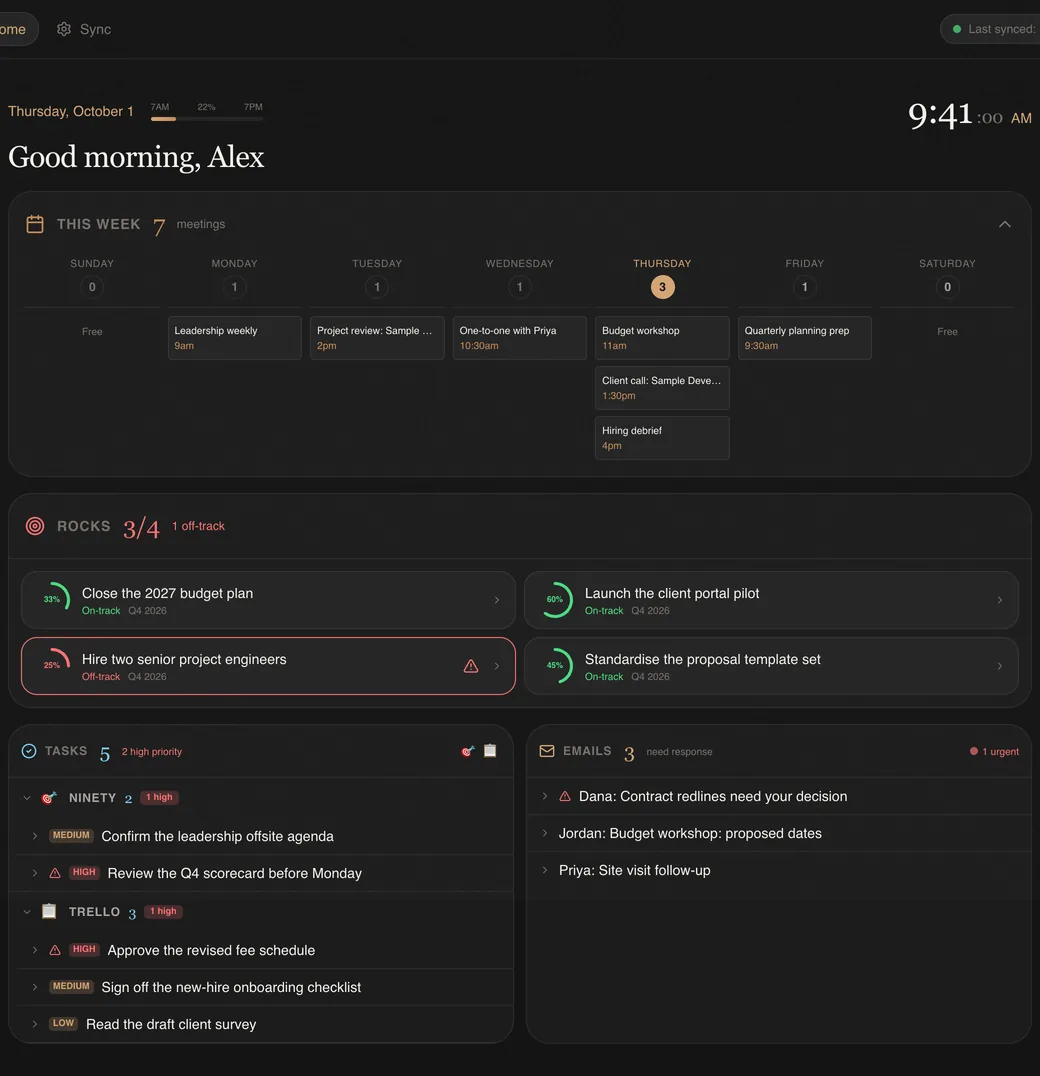
A separate prototype: a personal briefing of priorities, tasks, emails and meetings, filled by a browser assistant that reads the user’s own tools. It was paused before launch. These pictures are its own code with an invented user and invented items.
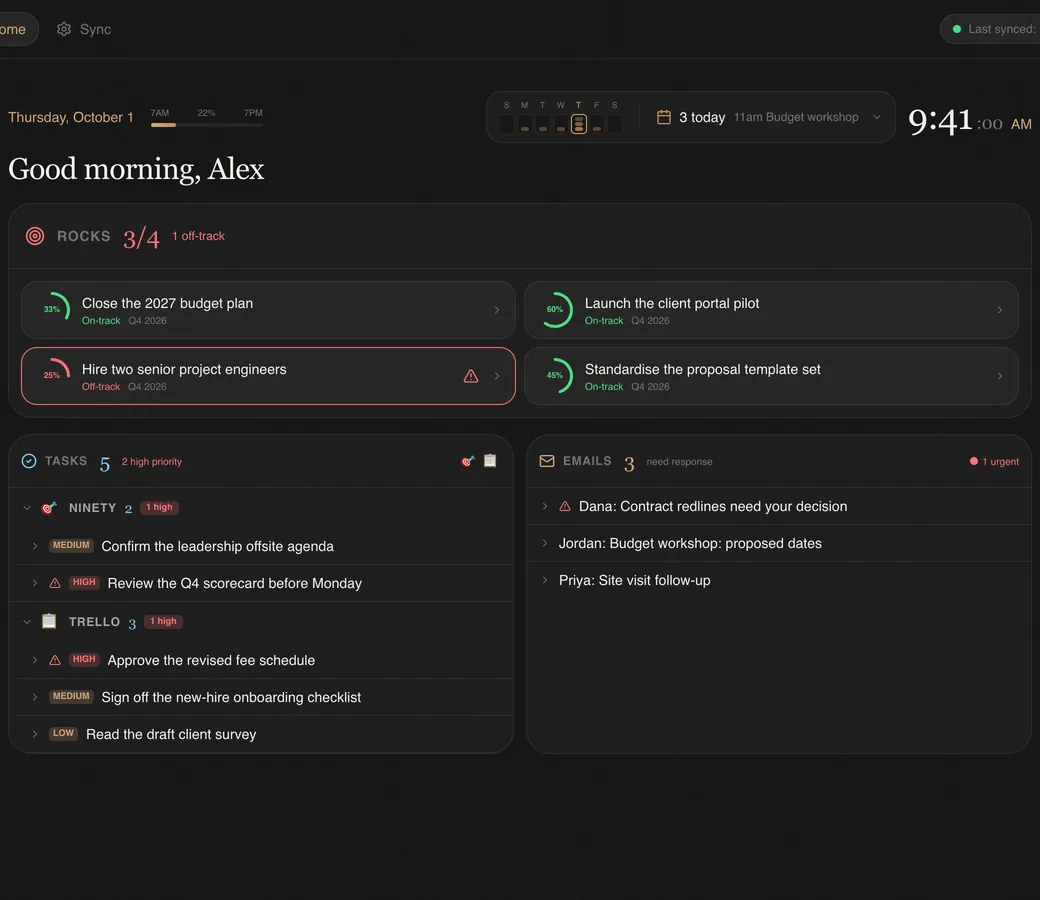
A dark briefing page with a greeting, four priorities, a task list and an email list
A morning briefingPriorities with progress rings, tasks grouped by where they came from, and the emails that need a reply. Local run, invented user and items.
A week of meetings in seven columns above priorities and tasks
The week openedSeven day columns with their meetings above the same briefing. Local run, invented user and items.
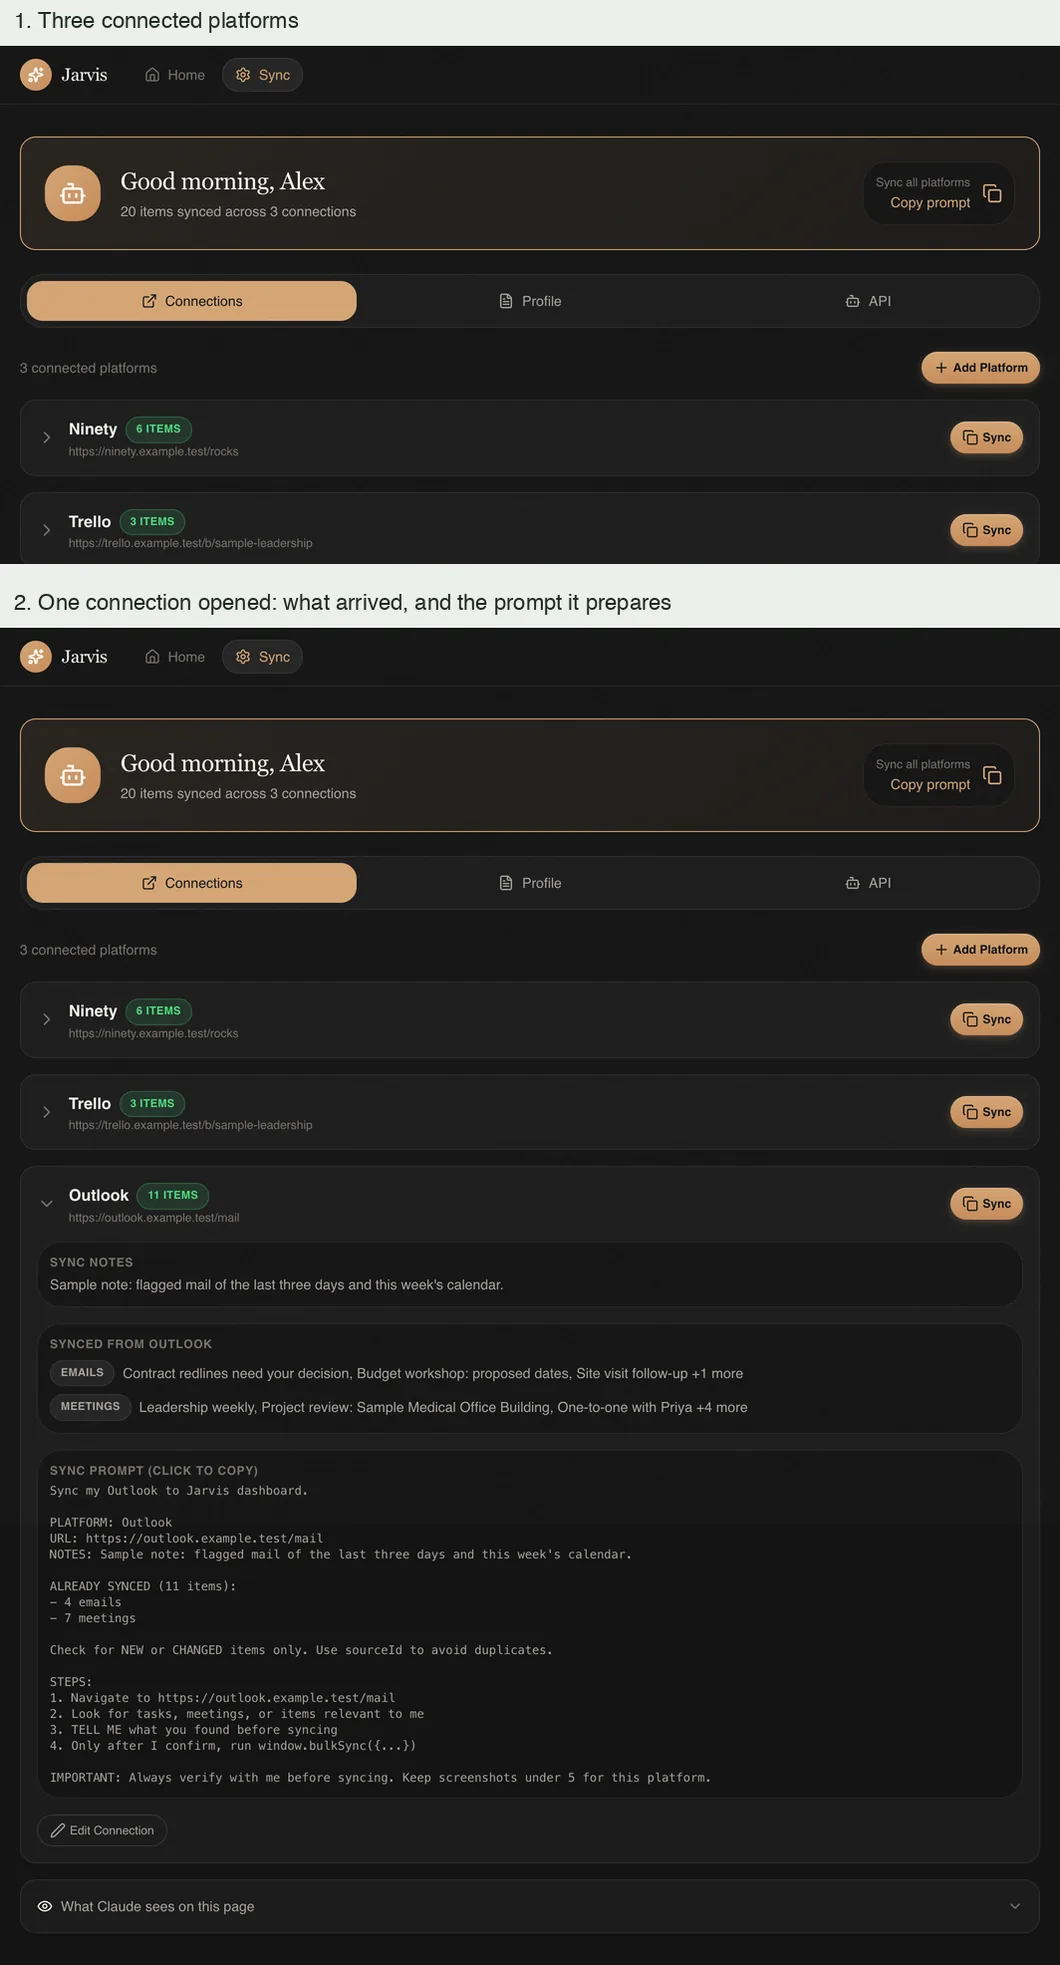
A list of three connected platforms, then one expanded with its synced items
Where the data comes fromThree connected platforms, and one opened to what arrived from it and the prompt the page prepares for a browser assistant. Local run, invented user and items.

Where it stands

Delivered, with validation ahead.

The research workspace is delivered. Estimates depend on reconciling the source records first, so the estimating tools are treated as exploratory until that matching is complete. A separate executive-briefing prototype was not launched.

Keep exploringProposal Manager